- Title
-
A conserved regulatory program initiates lateral plate mesoderm emergence across chordates
- Authors
- Prummel, K.D., Hess, C., Nieuwenhuize, S., Parker, H.J., Rogers, K.W., Kozmikova, I., Racioppi, C., Brombacher, E.C., Czarkwiani, A., Knapp, D., Burger, S., Chiavacci, E., Shah, G., Burger, A., Huisken, J., Yun, M.H., Christiaen, L., Kozmik, Z., Müller, P., Bronner, M., Krumlauf, R., Mosimann, C.
- Source
- Full text @ Nat. Commun.
|
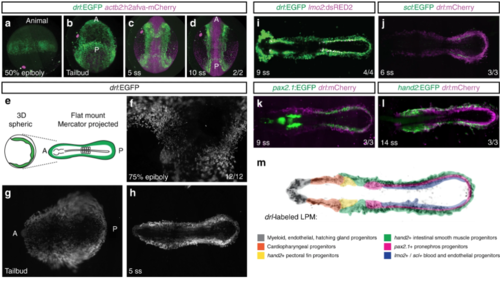
The LPM forms as a continuous field around the circumference of the developing zebrafish embryo. a? d Panoramic SPIM imaging of 50% epiboly to 10 ss embryos transgenic for drl:EGFP (green) and actb2:h2afva-mCherry (magenta); maximum-intensity-projected, lateral view ( a), dorso-ventral views (anterior (A) to the top, posterior (P) bottom) (n?=?2/2) ( b? d). e? h Representative panoramic SPIM imaged drl:EGFP zebrafish embryo shown as 2D Mercator projection (n?=?12/12). e Schematic of Mercator projection of spherical embryo, anterior to the left; f? h Mercator projections at 75% epiboly, tailbud, and 5 ss stages. i? l Single time point projections (anterior to the left) of representative double-transgenic embryos for drl reporters and ( i) lmo2 (n?=?4/4), ( j) scl (n?=?3/3), ( k) pax2.1 (n?=?3/3), or ( l) hand2 (n?=?3/3) reporters co-expressed in dedicated LPM territories. m Summary schematic of the LPM fate territories partitioning during early somitogenesis in zebrafish |
|
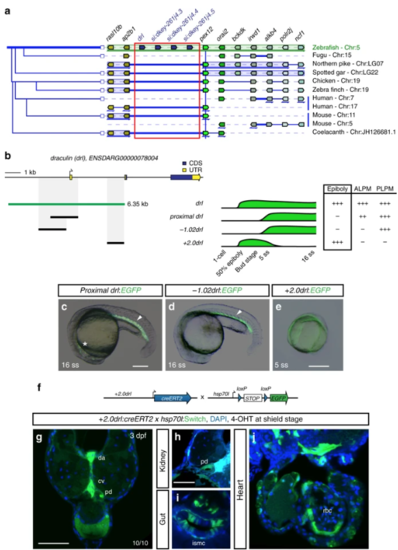
The 6.35?kb drl cis-regulatory region contains an early pan-LPM enhancer. aAdapted Genomicus-based PhyloView representation of the zebrafish drllocus (top row) compared to other vertebrate species. The view is centered on pex12 (light green, blue vertical line) as anchor, with its orthologous copies across species and corresponding neighboring loci shown by their relative positions. Genes with identical coloration are homologs/orthologs. Blue arrows below gene loci indicate switched local orientation. The phylogenetic relationship tree is depicted on the left. The red box marks the drl locus with its neighboring three drl-related genes (blue) in between ap2b1and pex12 in zebrafish as unique feature. Note the absence of any genes between ap2b1 and pex12 orthologs across fishes and other vertebrates, and conservation of suggested ancestral synteny of ap2b1 and pex12. b Schematic of the drl locus depicting the 6.35?kb cis-regulatory region (green), and smaller isolated candidate fragments proximal drl (region surrounding first exon), ?1.02drl (upstream region only), and + 2.0drl (distal first intron) with specific reporter activity. Time line and table indicates expression dynamics (50% epiboly to 16 ss) of stable transgenes for the individual regulatory elements and expression domains (pan-LPM early or somite-stage ALPM, PLPM) with absent expression (-) to strong expression (+ +). c? eRepresentative stable transgenic zebrafish embryos harboring EGFP reporters for proximal drl, ?1.02drl, and + 2.0drl; at 5 ss and 16 ss proximal drland ?1.02drl express in PLPM (arrowheads in c, d), proximal drl additionally in ALPM (asterisk in c); note pan-LPM activity of + 2.0drl ( e). f Schematic of + 2.0drl:creERT2 to hsp70l:Switch cross for genetic lineage tracing. g? jTransverse sections at 3 dpf of + 2.0drl:creERT2 lineage tracing after 4-OHT induction at shield stage results in specific labeling of LPM-derived tissue including red blood cells (rbc), dorsal aorta (da) and cardinal vein (cv) endothelium, pronephric duct (pd), and intestinal smooth muscle cells (ismc) ( n?=?10/10). + 2.0drl:creERT2 also traces endoderm-derived tissue, shown for gut epithelium. Nuclei counterstained with DAPI (blue). Scale bars ( c, e, g) 250?µm and ( h) 50?µm |
|
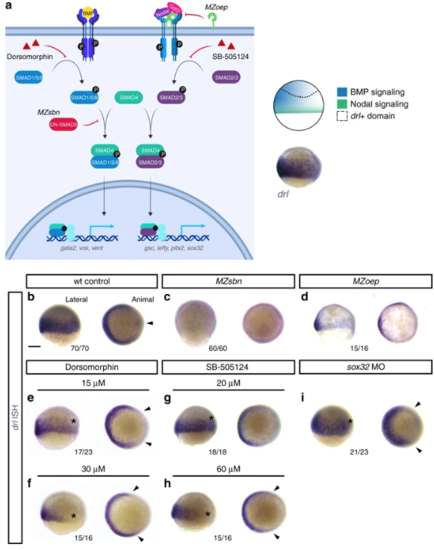
Early drl-expressing LPM progenitors respond to ventral BMP. a Schematic of the BMP and Nodal signaling pathways and the corresponding signaling territories in the gastrulation-stage zebrafish embryo, compared to endogenous drl expression marked by mRNA ISH. Pathway schematic generated with BioRender. b? i mRNA ISH for endogenous drl expression during early gastrulation (shield stage to 75% epiboly), lateral view on the left and animal view on the right. b? d Wildtype (wt) controls ( n?=?70/70), BMP-perturbed ( MZsbn, a dominant-negative Smad5 allele, n?=?60/60) and Nodal-perturbed ( MZoep, mutant for the required Nodal co-receptor Oep, n?=?15/16) showing that BMP perturbation abolishes endogenous drl expression. e? h Chemical inhibition of BMP via Dorsomorphin (15??M ( n?=?17/23) and 30??M ( n?=?15/16), e, f) decreases ventral drl expression, while chemical Nodal inhibition with SB-505124 (20??M ( n?=?18/18) and 60??M ( n?=?15/16), g, h) decreases dorsal drl expression, as indicated with the asterisks in the lateral views and the arrowheads in the animal views. i sox32 morphants that fail to form endoderm also lose dorsal drl expression, as indicated with asterisk in the lateral view and with arrowheads in the animal view ( n?=?21/23). Scale bar ( b) 250??m |
|
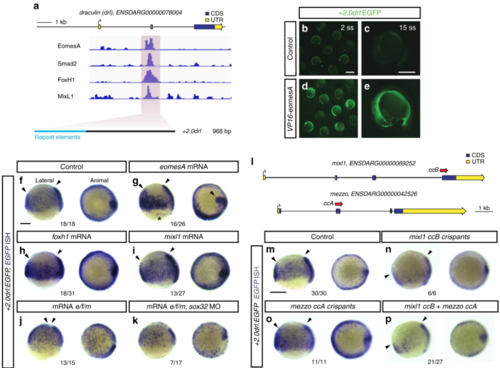
EomesA, FoxH1, and MixL1 together can induce the + 2.0drl enhancer. a ChIP-seq tracks for EomesA. FoxH1, MixL1, and Smad2 in the drl locus. See text for details. Bottom depicts the + 2.0drl intronic enhancer and the smaller, minimally specific region + 2.4drl after removal of repeat sequences. b? e Constitutively-active VP16-EomesA boosts + 2.0drl:EGFPreporter expression in its native territory. Compared to injection controls ( b, c), microinjection of VP16-eomesA mRNA in + 2.0drl: EGFP reporter transgenics enhances and prolongs EGFP expression in the native reporter expression domain ( d, e). f? k Gastrulation-stage (shield to 75% epiboly) zebrafish embryos, lateral view left and animal view right, probed with EGFP ISH to detect expression of + 2.0drl:EGFP. Compared to controls ( n?=?18/18) ( f), embryos injected with mRNA encoding full-length eomesA ( n?=?16/26), foxh1 ( n?=?18/31), or mixl1 ( n?=?13/27) show enhanced + 2.0drl:EGFP reporter activity ( g? i), as indicated by arrowheads. The asterisk in g points out ectopic expression in the enveloping layer cells. jCombining mRNAs encoding full-length eomesA (e), foxh1 (f), and mixl1 (m) ( e/f/m) triggers ectopic reporter expression also in dorsal blastomeres ( n?=?13/15, compared to native reporter expression pattern in f), an activity that also remained in embryos devoid of endoderm after sox32 morpholino injection ( n?=?7/17) ( k). l? p Mixl1 acts on the + 2.0drlenhancer as analyzed in Cas9 RNP-mediated crispants. l Schematic representation of the mixl1 and mezzo loci, with the individual sgRNAs for mutagenesis annotated ( cc for CRISPR cutting, followed by sgRNA index). m? p mRNA in situ hybridization of EGFP expression in + 2.0drl: EGFP embryos as crispant control ( n?=?30/30) ( m), injected with Cas9 RNPs of ( n) mixl1 ccB ( n?=?6/6), ( o) mezzo ccA ( n?=?11/11), and ( p) mixl1 ccB together with mezzo ccA sgRNA ( n?=?21/27); the resulting mosaic mixl1 ccB crispants show diminished + 2.0drl reporter expression at late gastrulation, as pointed out by arrowheads. Lateral and animal views as indicated. Scale bar in ( b) 500??m, ( c) 250??m |
|
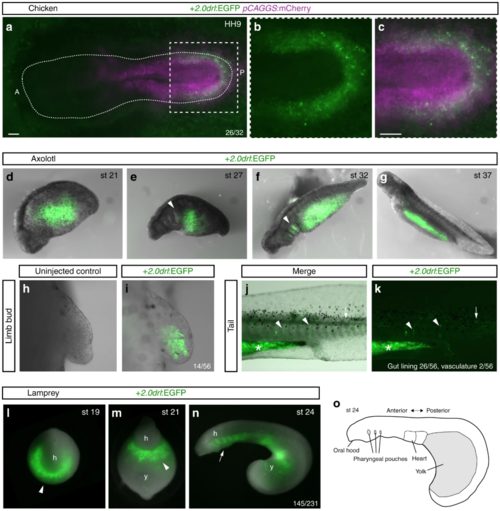
The zebrafish + 2.0 drl enhancer reads out a LPM program across vertebrates. a? c Representative HH9 ex-ovo-cultured chicken embryo electroporated at HH3+/4 with + 2.0drl:EGFP (green, a? c) and ubiquitous pCAGGS:mCherry control (magenta, a, c), showing specific + 2.0drl reporter expression in the electroporated LPM ( n?=?26/32). The dashed line depicts the outline of the chicken embryo, anterior (A) to the left, posterior (P) to the right; boxed region ( a) depicts magnified area shown for single and merged channels ( b, c). d? k Expression of +2.0 drl:EGFP upon transient injections in axolotl at the indicated embryonic stages. Note EGFP expression in the lateral portion of the embryo, future gut region, and pharyngeal arches (arrowheads in e, f). h, i EGFP expression in mesenchymal cells of the developing axolotl limb bud, indicative of LPM origin ( n?=?14/56). j, k EGFP fluorescence in axolotl st 43 larvae in the gut lining (asterisk, n?=?26/56) and blood vessels (arrowheads, n?=?2/56). Expression is also found occasionally in a small fraction of muscle fibers (arrows). l? o Transient transgenic lamprey embryos ( Petromyzon marinus) with + 2.0drl:EGFP expression in the anterior mesendoderm (arrowheads) and overlying the yolk at neurula stages (st 19?21) ( l, m), and in the developing pharynx (arrow) during head protrusion (st 23?24) ( n); views anterior ( l), ventral ( m), lateral ( n), head (h) and yolk (y) ( n?=?145/231). o Schematic depiction of st 23 lamprey embryo to outline key features. Scale bar ( a, c) 250??m |
|
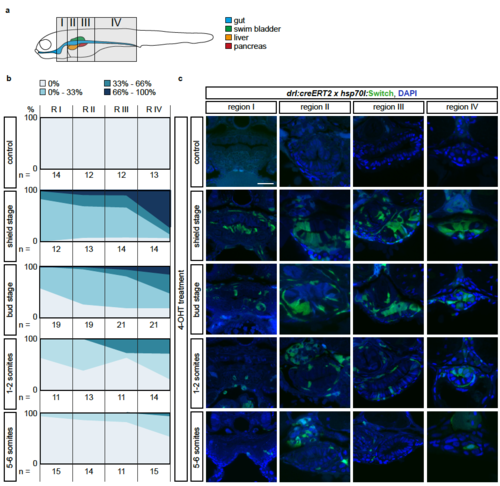
The LPM specifies within the mesendoderm with a temporal and an anterior-posterior gradient (a) Schematic of the four regions I-IV defined to study anterior-posterior differences in lineage-labeling of the gut epithelium. Region I is the most rostral and includes the pharynx and the heart; Region II inlcudes the esophagus, the beginning of the swim bladder (pneumatic duct), the liver, and the anterior tip of the pancreas; Region III includes the gut, pancreas, and swim bladder; region IV includes the most caudal part of the gut and is recognizable by the yolk extension. (b) Transverse sections of the gut of 3 dpf drl:creERT2;hsp70l:Switch embryos. Columns represent the region and rows represent the stage of 4- OHT induction. (C) For each section, the switching efficiency in the gut epithelium was classified into 0%, between 0-33%, between 33-66% or between 66- 100%. The Y-axis represents the fraction number of embryos. Indicated n-numbers represent the number of embryos analyzed. Embryos were collected in three independent experiments. Scale bar 25 ?m. |
|
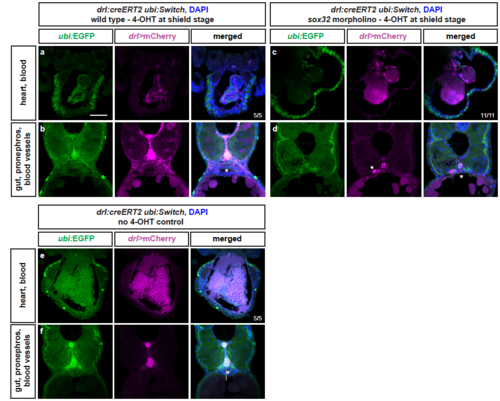
LPM lineages and organs still arise in embryos devoid of endoderm Representative transverse sections of drl:creERT2 x ubi:Switch (ubi:lox-GFP-lox_mCherry) embryos fixed at 3 dpf. (a,b) Embryos were induced with 4-OHT at shield stage, bringing mCherry under control of the ubi promoter in cells with active CreERT2 from shield stage (magenta), while unrecombined cells keep expressing GFP (green). LPM-derived organs, as depicted for heart, blood, pectoral fins, pronephros, and endothelial cells, and endoderm-derived lineages, including swim bladder, gut epithelium, and liver, are lineage-traced (n=5/5). (c,d) In sox32 morphants that are devoid of endoderm, 4-OHT induction at ,shield stage still traced LPM-derived organs, as depicted for heart, blood, pectoral fins, pronephros (arrow), and endothelial cells (n=11/11). (e,f) Control without 4-OHT admission reveals absence of any background activity of the used ubi:Switch reporter (note autofluoresence of blood), confirming absence of leakiness of the creERT and loxP lines used (n=5/5). Asterisks indicate endoderm-derived gut epithelium (b,f) or absence thereof (d). Nuclei counterstained with DAPI (blue). Scale bar 25 ?m |
|
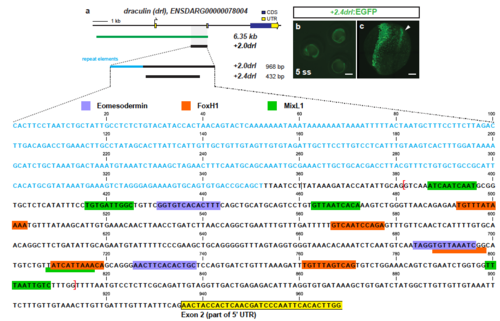
Trimming of +2.0drl to the minimal 432 bp LPM +2.4drl enhancer region (a) Schematic representation of the -6.35drl locus including the PCR-based trimming approach to map the smallest LPM specific regulatory enhancer region; repetitive elements highlighted in blue. Sequence depicts the +2.0drl region in intron 1 (Danio rerio strain Tuebingen chromosome 5, GRCz11 primary assembly, NC_007116.7:61649227-61650194): blue text depicts repetitive elements, colored boxes depict predicted transcription factor binding sites (JASPAR database for vertebrates, 80-85% threshold), yellow frame marks the beginning of drl exon 2, and red brackets outline the sequence for the +2.4drl core sequence. (b) Expression of +2.4drl:EGFP at 5 ss; arrow indicates axial mesoderm expression, indicating increased promiscuity after trimming from the initial +2.0drl element. Scale bar 400 ?m (b) and 80 ?m (c). |
|
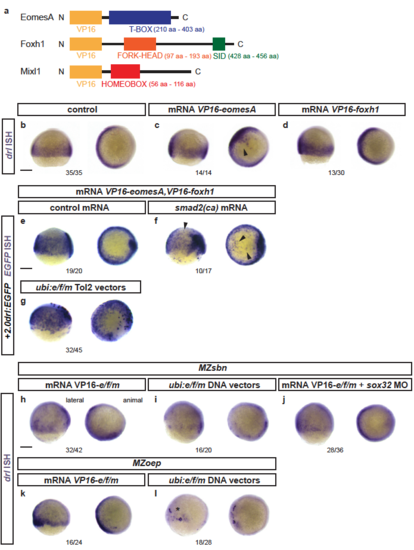
Response of endogenous drl and drl reporters to EomesA, Foxh1, and Mixl1 expression (a) Schematics of EomesA, Foxh1, and Mixl1 fusion proteins with the N-terminally added VP16 transactivation domain to generate constitutively-active transcription factors. Note that the expressed VP16-EomesA is restricted to the T-box of EomesA. (b-d) mRNA ISH for endogenous drl expression in controls (n=35/35) (b) and embryos injected with VP16-fusions based on eomesA (n=14/14) (c) or foxh1 (n=13/30) (d). (e,f) mRNA ISH for EGFP transcript expression in +2.0drl:EGFP embryos at shield to 70% epiboly stage after injecting a combination of VP16-fused eomesA and foxh1 (e/f) without (n=19/20) (e) or with (n=10/17) (f) constitutive-active smad2 that mimicks pan-Smad signaling (smad2(ca)), resulting in dorsal widening of the reporter expression pattern. (g) Injection of Tol2-based constructs under ubiquitous ubi promoter control to drive native eomesA (full-length), foxh1, and mixl1 (e/f/m), resulting in mosaic induction of +2.0drl:EGFP, including individual dorsal blastomeres (n=32/45). (h-j) Endogenous drl expression revealed by mRNA ISH in BMP signaling-mutant (MZsbn) embryos injected with either (h) VP16-e/f/m mRNA (n=32/42), (i) ubi:e/f/m DNA vectors (n=16/20), or (j) VP16-e/f/m mRNA in an endoderm-perturbed background (sox32 morpholino) (n=28/36). (k,l) mRNA ISH for endogenous drl expression in Nodal-mutant (MZoep) embryos injected with (k) VP16-e/f/m mRNA (16/24) or (l) ubi:e/f/m Tol2 vectors (17/28); note the localized clones of strong drl upregulation on the ventral side upon ubi:e/f/m injection. Scale bar 250 ?m. |
|
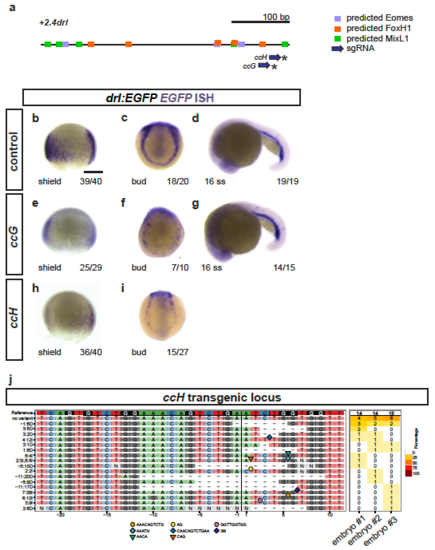
Crispant analysis of the +2.0drl region (a) Schematic representation of the minimal +2.4drl LPM enhancer region (core of +2.0drl) with Eomes, FoxH1, and Mixl1 binding site predictions (JASPAR) and sgRNAs ccG and ccH annotated. (b-i) ISH for EGFP in +2.0drl:EGFP embryos shown for injection controls (b-d) or individually mutagenized using reconstituted Cas9 protein-sgRNA complexes with either sgRNA (e-g) ccG or (h,i) ccH (asterisks in a), both showing mosaic loss or reduction of reporter expression at shield and bud stage compared to uninjected controls. Reporter expression that is dependent on different regulatory elements remains intact upon mutagenesis with both sgRNAs, as observed at 16 ss (d,g). These results indicate no overt mutagenesis of essential parts in the transgene itself. (j) Panel plot showing mutagenesis efficiency and allele spectrum in three representative ccH crispants, as created by CrispRVariants. The genomic reference sequence is shown on top, with the 20 bp ccH sgRNA followed by a 3 bp PAM indicated by the boxed regions. The Cas9 cleavage site is represented by a black vertical bar. Deletions are indicated by a minus (-) and insertion sequences by symbols. The right column of the plot shows detected allele frequency per analyzed embryo. Scale bar (b) 250 ?m. |
|
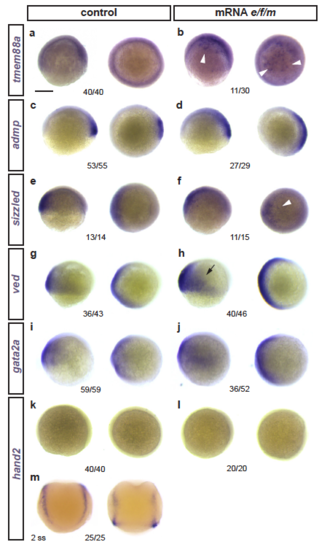
Effects of eomesA, foxh1, and mixl1 misexpression on early developmental genes (a-m) Zebrafish embryos ((a-l) shield to 75% epiboly or (m) 2 ss) as control or injected with mRNA for eomesA, foxh1, and mixl1 (e/f/m), with mRNA ISH for indicated candidate genes. Latera view left, animal view right for each condition. (a,b) The early LPM gene tmem88a that is weakly expressed during epiboly (a) becomes activated in patches upon e/f/m misexpression (b, arrowheads). (c-j) Expression of various gastrulation-stage marker genes: admp (c,d), sizzled (slightly increased expression ventral, indicated by arrowhead) (e,f), ved (slight increased expression ventral, arrow) (g,h), gata2a (slight ventral expansion) (i,j). (k-m) The somite-stage LPM gene hand2 does not become ectopically induced upon e/f/m misexpression (k-l), as tested with a functional mRNA ISH probe (shown for 2 ss in m). Indicated n-numbers represent the number of embryos analyzed. Scale bar (a) 250 ?m |
|
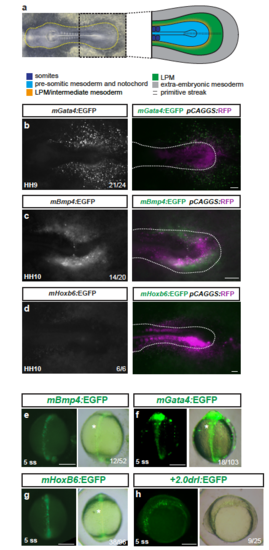
Mouse LPM enhancers show specific activity in chick, but not in zebrafish embryos (a) Bright field image of an HH10 stage chicken embryo, anterior to the left, with schematic depiction of the posterior body (right), prospective LPM in green. (b-d) Ex ovo-cultured chicken embryos at HH9-HH10, electroporated at HH3+/H4 with reporters based on mouse LPM enhancers from mGata4 (n=21/24) (b), mBmp4 (n=14/20) (c), and mHoxb6 (n=6/6) (d) driving EGFP (grayscale), including a merged overlay together with electroporation marker plasmid pCAGGS:RFP (magenta, driving ubiquitous expression as electroporation control). Dashed lines (b-d) indicate the posterior outline of the individual chicken embryos, marking the predicted boundary between embryo and extra-embryonic tissue. (e-h) Zebrafish embryos depicted at early somitogenesis stages (dorsal views in e-g, lateral view in h) injected with EGFP reporters for mBmp4 (n=12/52) (e), mGata4 (n=18/103) (f), and mHoxb6 (n=38/96) (g) compared to +2.0drl:EGFP (n=9/25) (h), revealing axial mesoderm expression of the tested mouse enhancers. Asterisks point out axial mesoderm expression. Scale bar (b-d) 250 ?m, (e-h) 200 ?m. |
|
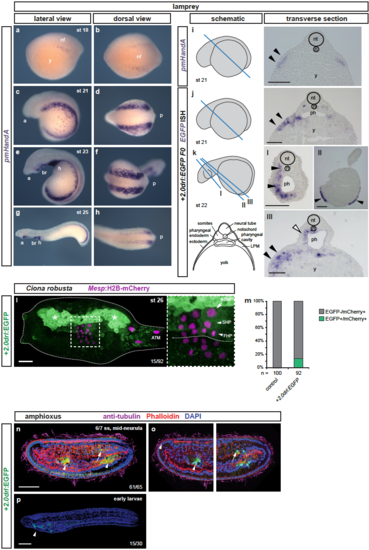
+2.0drl drives specific reporter expression in lamprey, Ciona, and amphioxus (a-d) Whole-mount ISH for pmHandA marks the LPM in lamprey embryos from neurula to hatching stages (st 18-25). (a) Expression is first detectable as bilateral stripes in the PLPM at st 18. (b,c) Later, the PLPM expression expands covering the yolk, and pmHandA is upregulated in the heart tube, branchial region, and caudal to the heart. Lateral and dorsal views are shown with the anterior (a) of the embryo to the left. (i-k) Transverse sections of fixed st 21-22 embryos. The schematics indicate the plane of sectioning in blue and sections are shown with dorsal to the top. The schematic transverse section represents k-III. (i) ISH for pmHandA at st 21 marking the LPM (black arrowheads). (j,k) ISH for EGFP in transverse sections of +2.0drl:EGFP transient transgenic lamprey embryos fixed at st 21-22, showing enhancer activity in the anterior mesendoderm subjacent to the ectoderm (black arrowheads), in the pharyngeal endoderm (k-III, white arrowhead), in the pharyngeal mesoderm (k, black arrowheads), and in some embryos in the ectoderm as commonly observed unspecific expression of reporter plasmids (k-II, black arrowheads). (l,m) Immunostaining for EGFP in Ciona larvae embryo (st 26) expressing drl reporters (green) and Mesp:H2B-mCherry to track the B7.5 nuclei cell lineage (red). (L) Expression of +2.0drl-driven EGFP reporter in the larvae is stained in the mesenchymal lineage (white asterisks) and in the B7.5 cell progeny including ASM precursors (ASMP) (white arrow) and both cardiac first and second heart precursors (FHPs and SHPs) (white arrowheads), zoomed in box. Anterior to the left. (m) Proportion of larvae embryos expressing both GFP and mCherry in the B7.5 lineage when co-electroporated drl reporter and Mesp:H2B-mCherry in comparison to the control. N = number of electroporated larval halves. (n-p) Confocal Z-stack of amphioxus embryo at mid-neurula stage (6/7 ss), injected with +2.0drl:EGFP, showing specific reporter activity in the lateral endoderm (arrowhead), and ventral half of the somites (n=61/65, arrows). Embryos counterstained with Phalloidin (red), embryos/larvae with DAPI (blue), and anti-acetylated tubulin antibody (magenta). Lateral view shown as 3D-rendering (n) or Z-stack sagittal sections (o), anterior to the left and dorsal to the top. At early larvae stage (p), the activity of +2.0drl reporter was observed in the developing pharynx (n=15/30, arrowhead). Branchial region (br), heart (h), neural folds (nf), neural tube (nt), notochord (n), pharynx (ph), and yolk (y) labeled (i-k). Scale bars (i-k) 200 ?m, (l) 25 ?m, (n,p) 50 ?m. |

