Fig. 1
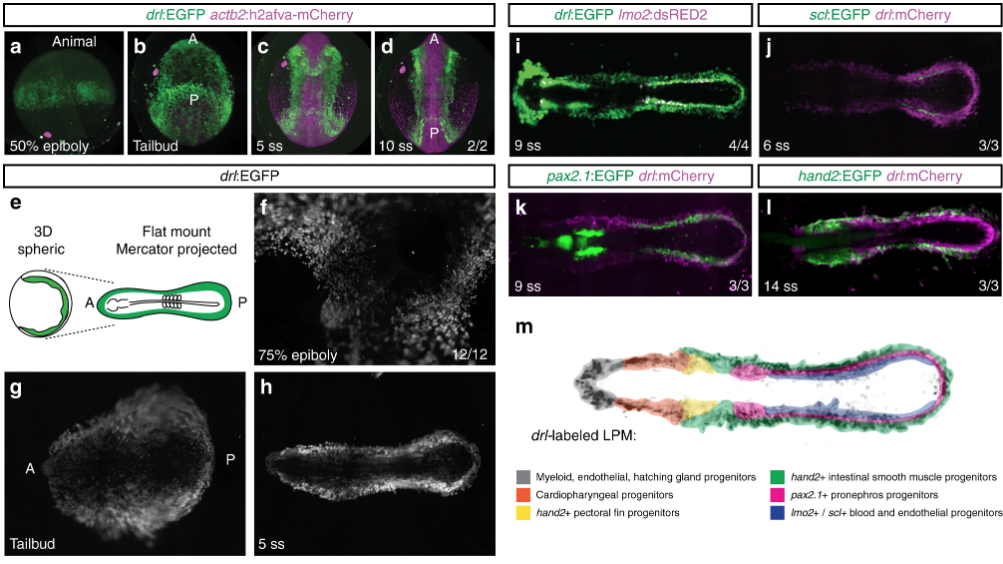
The LPM forms as a continuous field around the circumference of the developing zebrafish embryo. a– d Panoramic SPIM imaging of 50% epiboly to 10 ss embryos transgenic for drl:EGFP (green) and actb2:h2afva-mCherry (magenta); maximum-intensity-projected, lateral view ( a), dorso-ventral views (anterior (A) to the top, posterior (P) bottom) (n = 2/2) ( b– d). e– h Representative panoramic SPIM imaged drl:EGFP zebrafish embryo shown as 2D Mercator projection (n = 12/12). e Schematic of Mercator projection of spherical embryo, anterior to the left; f– h Mercator projections at 75% epiboly, tailbud, and 5 ss stages. i– l Single time point projections (anterior to the left) of representative double-transgenic embryos for drl reporters and ( i) lmo2 (n = 4/4), ( j) scl (n = 3/3), ( k) pax2.1 (n = 3/3), or ( l) hand2 (n = 3/3) reporters co-expressed in dedicated LPM territories. m Summary schematic of the LPM fate territories partitioning during early somitogenesis in zebrafish

