
- Title
-
Investigation of F-BAR domain PACSIN proteins uncovers membrane tubulation function in cilia assembly and transport
- Authors
- Insinna, C., Lu, Q., Teixeira, I., Harned, A., Semler, E.M., Stauffer, J., Magidson, V., Tiwari, A., Kenworthy, A.K., Narayan, K., Westlake, C.J.
- Source
- Full text @ Nat. Commun.
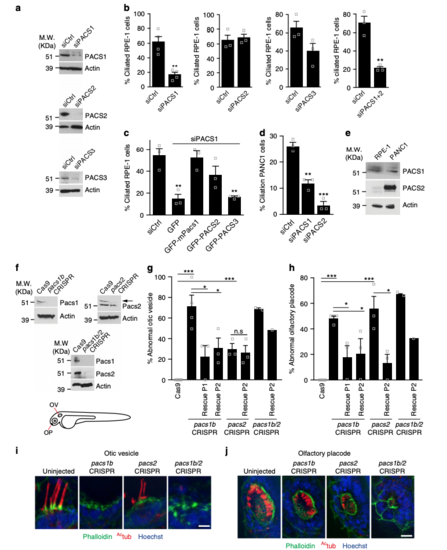
PACSIN1 and -2 are required for ciliogenesis. a Western analysis of PACSINs depletion in RPE-1 cells treated with siCtrl or siPACSINs (sequences in Supplementary Table 1). bQuantification of ciliated cells treated as in a (n = 4 independent experiments, siCtrl = 801, siPACS1 = 543 cells in total; n = 3, Ctrl = 215, siPACS2 = 128 cells; n = 3, siCtrl = 107, siPACS3 = 85 cells; n = 3, siCtrl = 106, siPACS1+2 = 75 cells). Images are in Supplementary Figure 1a. cQuantification of ciliation in RPE-1 cells treated with siPACSIN1 for 6 h, rescued with indicated constructs and starved at 48 hpf (n = 3, siCtrl = 108, GFP = 71, GFP-mPacs1 = 39, GFP-PACS2 = 75, GFP-PACS3 = 55 cells). d Quantification of ciliation in PANC1 cells treated as in b (n = 3, siCtrl = 273, siPACS1 = 194, siPACS2 = 175 cells). e Western analysis of PACSINs expression in RPE-1 and PANC1 cells. f Western analysis of Pacsins expression in 3 days post fertilization (dpf) CRISPR mutants (gRNA sequences shown in Supplementary Table 1). Arrow indicates Pacsin2 band. Schematic of organs of interest (Otic vesicle: OV, and Olfactory placode: OP). g Quantification of abnormal OV from embryos as in f and rescued with human PACSIN RNAs. Cas9, 38 OVs, n = 5; pacs1bCRISPR, 37 OVs, n = 4; pacs1bCRISPR + hPACSIN1, 20 OVs, n = 3; pacs1bCRISPR + hPACSIN2, 16 OVs, n = 3; pacs2CRISPR, 23 OVs, n = 3; pacs2CRISPR + hPACSIN2, 20 OVs, n = 3; pacs1b/2CRISPR, 15 OVs, n = 2; pacs1b/2CRISPR + hPACSIN2, 5 OVs, n = 1. Images are shown in (i) (scale bar: 5 μm). h Quantification of abnormal OP in embryos injected as in g. Cas9, 37 OPs, n = 5; pacs1bCRISPR, 25 OPs, n = 4; pacs1bCRISPR + hPACSIN1, 17 OPs, n = 3; pacs1bCRISPR + hPACSIN2, 14 OPs, n = 3; pacs2CRISPR, 18 OPs, n = 3; pacs2CRISPR + hPACSIN2, 19 OPs, n = 3; pacs1b/2CRISPR, 15 OPs, n = 2; pacs1b/2CRISPR + hPACSIN2, 6 OPs, n = 1. Images are shown in j (scale bar: 10 μm). Images in i and j are maximum intensity projections of deconvolved z-stacks. Means ± SEM. Two-tailed t-test analyses as compared with siCtrl in b and d or as indicated in figure. *P < 0.05, **P < 0.001, non significant (n.s) PHENOTYPE:
|
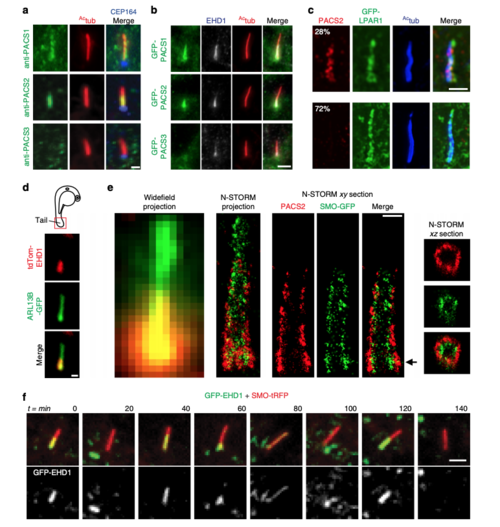
PACSIN and EHD proteins display dynamic CPM trafficking. a Representative images of RPE-1 cells serum starved for 24 h and stained with antibodies for PACSINs, Actub, and CEP164. PACSIN2 antibody showed lower levels of background staining in RPE-1 cells as compared to the PACSIN1 antibody. b Representative images of GFP-PACSINs expressed in RPE-1 cells as in a and stained with antibodies for EHD1 and Actub. Note that GFP-PACSIN1 and GFP-PACSIN2 always co-localized with EHD1 (GFP-PACSIN1 = 85, GFP-PACSIN2 = 90 cells). SDC images in a and b are maximum intensity z-projections. Scale bar: 2 μm. c N-SIM images of cilia from cells transiently transfected with GFP-LPAR1, serum starved for 24 h, and stained with Actub and PACSIN2 antibodies. Images are single xy planes. Scale bar: 2 μm. dRepresentative image of tdTom-EHD1 and the ciliary membrane marker ARL13B-GFP expressed in a cilium from the tail region (red box in schematic; top panel) of a 24 hpf embryo. SDC images are maximum intensity z-projections. Scale bar: 1 μm. eRepresentative images of epifluorescence (left panel) and N-STORM projections (middle left panel) from 24 h serum-starved SMO-GFP RPE-1 cells stained with PACSIN2 antibody as described in Methods. Images of a single xy plane bisecting the cilium (middle right panels). Orthogonal views of N-STORM images corresponding to the black arrow (right panels). Scale bar: 300 nm. f GFP-EHD1 + SMO-tRFP cells were serum starved for 24 h and imaged live every 20 min. Images are single xy planes (30 ciliated cells). Scale bar: 2 μm |
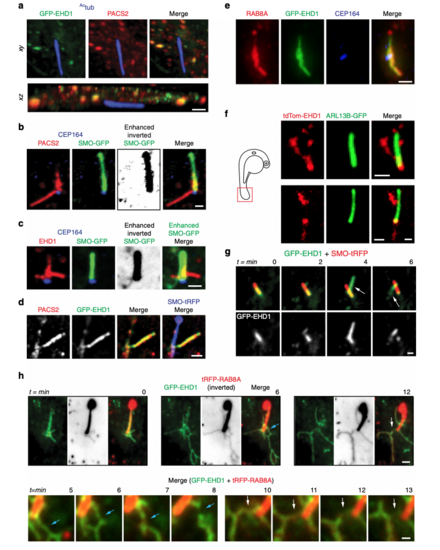
PACSIN and EHD proteins accumulate on CPM tubules that contain RAB8A. a Representative 3D volume view images (generated by SlideBook) of GFP-EHD1 cells serum starved for 24 h and stained with antibodies to PACSIN2 and Actub. The z-stack was captured using a SDC microscope and a CMOS camera. b, c SMO-GFP cells imaged as in a and stained with antibodies to PACSIN2 or EHD1, CEP164, and anti-GFP. Contrast enhanced and inverted image in the middle right panel demonstrate the absence of SMO-GFP in PACSIN2/EHD1 tubules. d Representative N-SIM maximum intensity projection images of CPM-associated membrane tubules in ciliated GFP-EHD1 (green) + SMO-tRFP (pseudo-colored blue) cells stained with PACSIN2 antibody (pseudo-colored red). e Epifluorescence projected z-stack images of a GFP-EHD1-positive CPM-tubule in ciliated cells stained with RAB8A and CEP164 antibodies highlighting the presence of endogenous RAB8A in both the ciliary membrane and the CPM tubules (7 cells). f Representative image of CPM-associated membrane tubules in tail cilia of 24 hpf zebrafish embryos expressing tdTom-EHD1 and ARL13B-GFP imaged by SDC microscope with a CMOS camera. Tail region is represented by red box in schematic of zebrafish embryo on the left. g GFP-EHD1 + SMO-tRFP cells were starved for 24 h and imaged live every 2 min (16 ciliated cells). Arrows mark dynamic tubules associated with the CPM over time. h GFP-EHD1 cells transiently transfected with tRFP-RAB8A, starved for 24 h, and imaged live using TIRF-M (upper panels). tRFP-RAB8A signal is shown inverted (middle images) and in red (merged right images). Arrows indicate breaks in membrane tubules. Scale bar: 1 μm. Enlarged regions (lower panels) from upper images showing membrane tubule breaks with additional time-lapse images added (12 cilia). Scale bar: 500 nm. Images in (g) and (h) are single xy planes. Scale bars: 1 μm for all images unless specified |
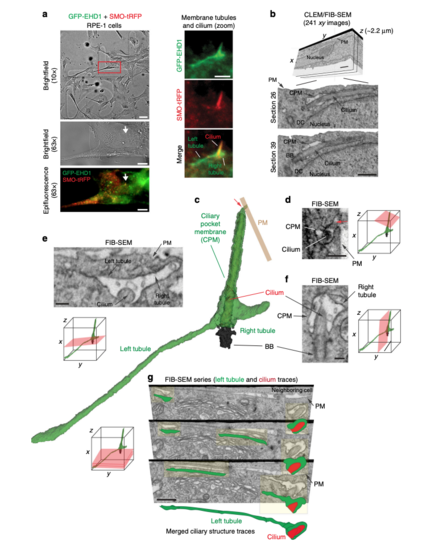
Three-dimensional FIB-SEM analysis shows membrane tubules connected to the CPM. aBrightfield and epifluorescence images of serum starved GFP-EHD1 + SMO-tRFP cells with membrane tubules associated with the cilium. Left panels show brightfield and fluorescence images at 10× and 63× used to identify the position of the ciliated cell on an alphanumerical grid for CLEM/FIB-SEM analysis (red box in top panel). Right panels show a 63× zoom of the cilium and associated membrane tubules (white arrow in the left panels). Scale bars: left top panel: 50 μm, left middle and bottom panels: 10 μm, right panels: 2 μm. b FIB-SEM image stack of the cell in a. Top panel shows a volume view of 241 xy plane FIB-SEM images (1102 × 472 pixels; 9 nm pixel size) with a cell depth (z) of ~2.2 μm (top panel). Middle and bottom panels show cropped FIB-SEM images of xy sections 26 and 39 with the cilium, CPM, basal body (BB), and daughter centriole (DC). Scale bars: 1 μm. The raw FIB-SEM image stack for the ciliary structures is available in Supplemental Movie 2. c 3D segmentation analysis of the FIB-SEM images in b using 3DSlicer software. Cilium (red), BB (black), CPM connected to the PM (red arrow) and the left and right CPM tubules (green). d–f FIB-SEM images showing the connection of the CPM with the PM (d, red arrow), transverse (e), and longitudinal (f) sections of the cilium from b. e, f show a shorter tubule (right tubule) and a longer tubule (left tubule), both attached to the CPM. Scale bars: 500 nm (d), 200 nm (e, f). g Representative FIB-SEM images (top three panels) from b showing the continuous left tubule connected to the CPM. Traces for the cilium (red) and the left tubule (green) are shown offset from FIB-SEM structures (yellow highlights) and merged in the bottom panel. Scale bar: 1 μm. d–g Orientation (red planar sheets) of the FIB-SEM images is indicated in the xyz model. b, d–g Images were generated with IMOD. CPM membrane tubules were observed by CLEM/FIB-SEM (2 cells) |
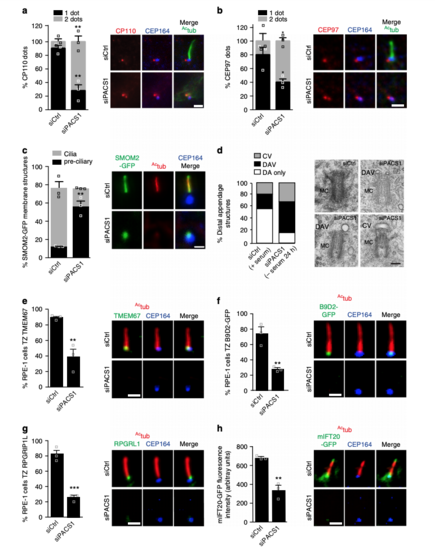
PACSIN1 functions at the CV stage prior to CP110 loss. a Quantification of CP110 dots in serum starved RPE-1 cells treated with siRNAs for 72 h, serum starved for the last 24 h, and stained with CP110, Actub and CEP164 antibodies. CP110 localization on both centrioles (2 dots) or only the daughter centriole (1 dot) was quantified (left panel, siCtrl = 100, siPACS1 = 63 cells). b Quantification of CEP97 dots in cells treated as in a and stained with CEP97, Actub, and CEP164 antibodies. CEP97 localization on the centrioles was quantified as in a(siCtrl = 201, siPACS1 = 125 cells). c Quantification of SMOM2-GFP centrosomal accumulation in cells treated as in a, and stained with Actub and CEP164 antibodies. “Preciliary” indicates SMOM2-GFP vesicle accumulation at the MC without axonemes (siCtrl = 100, siPACS1 = 67 cells). Scale bar: 2 μm for images in a–c. d Quantification of MC with non-ciliary distal appendages structures from cells treated as in a. Pooled data from 3 independent experiments (siCtrl = 56, siPACS1 = 41 cells). Representative electron micrographs of quantified MCs shown on right. Scale bar: 200 nm. MC mother centriole, DAV distal appendages vesicles, CV ciliary vesicle, or DA non-membrane-associated distal appendages. e–g Quantification of TZ accumulation of TMEM67 (e, siCtrl = 113, siPACS1 = 89 cells), B9D2-GFP (f, siCtrl = 365, siPACS1 = 250 cells), RPGRIP1L (g, siCtrl = 70, siPACS1 = 63 cells) in cells treated as in a. h mIFT20-GFP cells treated as in a, stained with Actub and CEP164 antibodies, and quantified for mIFT20 fluorescence intensity at the MC/BB (siCtrl = 46, siPACS1 = 43 cells). Scale bar: 2 μm for images in e–h. In a–c, and e–h, representative images of quantified cells shown on right and means ± SEM, n = 3 independent experiments. Two-tailed t-test analysis as compared with siCtrl was performed. **P < 0.001, ***P < 0.0001 |
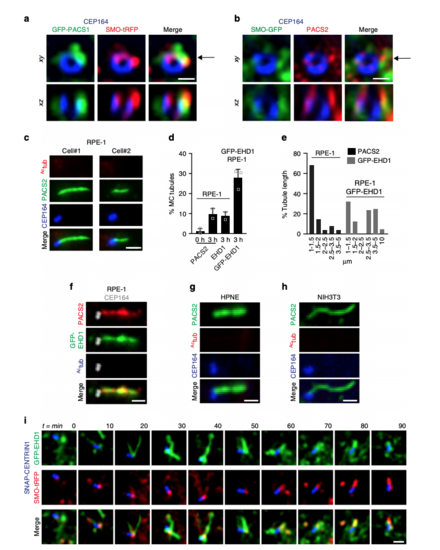
PACSIN and EHD proteins co-localize on dynamic MC-tubules during ciliogenesis. aRepresentative N-SIM images of SMO-tRFP cells transiently expressing GFP-PACSIN1, serum starved for 3 h, and stained with CEP164 antibody. b Representative N-SIM images of SMO-GFP cells serum starved for 3 h and stained with CEP164 and PACSIN2 antibodies. The xz images (bottom panels) in a and b show orthogonal views at the position of the arrow indicated in the xy plane (top panels). Scale bars: 500 nm. c Representative images of RPE-1 cells serum starved for 3 h and stained with CEP164, Actub and PACSIN2 antibodies. Images were taken by epifluorescence microscopy using a 63× objective. Maximum intensity projections of deconvolved z-stacks are shown. d Quantification of PACSIN2, EHD1, or GFP-EHD1-positive MC tubules in RPE-1 cells, serum starved at 0 and 3 h and stained with PACSIN2, EHD1 antibodies, or observed in GFP-EHD1 cells imaged as in c (PACS2 0 h = 79, PACS2 3 h = 140, EHD1 = 67 cells, pooled from n = 2; GFP-EHD1 = 100 cells, pooled from n = 3). Means ± SD. e Graph representing the length of PACSIN2 and GFP-EHD1-positive tubules in cells treated as in (c) (25 tubules per condition). f GFP-EHD1 cells serum starved for 3 h, stained with PACSIN2, Actub (Alexa 305 nm), and CEP164 (Alexa 647) antibodies, and imaged by epifluorescence microscopy using a 63× objective. Z-stack images were deconvolved and a single xy plane is shown. Note the co-localization of PACSIN2 and GFP-EHD1 in MC-associated tubules (25 cells). g, h HPNE (g) and NIH3T3 (h) cells serum starved for 3–6 h and stained with antibodies for PACSIN2, CEP164, and Actub. Images were taken with a 100× objective and are maximum intensity projections of deconvolved z-stacks. i Triple line starved for 3 h, labeled with 300 nM SNAP-Cell647-SiR substrate for the last hour, washed, and imaged live every 10 min. Images are single xy planes (15 cells). Scale bars: 1 μm for (c, f–i) |
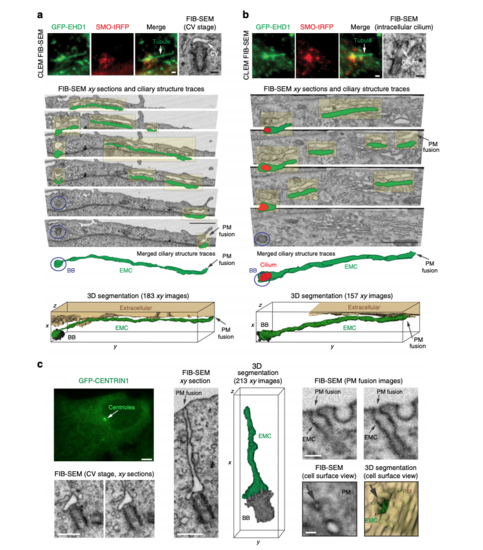
Membrane tubules connect the CV/developing cilium and the PM creating an extracellular membrane channel. a, b CLEM/FIB-SEM analysis of a 3 h starved GFP-EHD1 + SMO-tRFP cell showing a CV (a) and a short intracellular cilium (b) connected to GFP-EHD1-positive tubular membranes. Fluorescence images (upper left and middle panels, scale bar: 1 μm) and longitudinal FIB-SEM section of the BB/cilium (upper right panel, scale bar: 200 nm). Below are representative FIB-SEM xy image sections (183 sections in a and 157 sections in b) showing a continuous membrane tubule connecting the CV and short intracellular cilium to the PM, respectively (Scale bar: 1 μm). Blue circles highlight the BB region. Traces for the extracellular membrane channel (EMC) connected to the CV (a) or short intracellular cilium (b) are shown in green offset from FIB-SEM EMC structures (highlighted in yellow). The cilium outline is traced in red. Merged ciliary structure traces and 3D segmentation of the CV and short intracellular cilium and the EMC connected to the PM from the xy FIB-SEM images are shown in the last two lower panels. The raw FIB-SEM images for a can be found in Supplemental Movie 3 and b in Supplemental Movie 4. c CLEM/FIB-SEM of 3 h starved GFP-CENTRIN1 cell (fluorescence images in upper left panel, scale bar: 2 μm). Representative FIB-SEM images (213 xy images) (bottom left and middle left panels, scale bars: 500 nm) and 3D segmentation (middle right panel) showing an EMC connecting the CV and the PM. FIB-SEM images (right panels, scale bar: 100 nm) showing different cross-sections of the EMC connected to the plasma membrane (PM) (top right panels). A view of the cell surface showing the EMC opening at the PM (arrow) and the 3D segmentation of the EMC opening (green) at the PM (bottom right panels). A summary of CLEM FIB-SEM data sets is shown in Supplementary Table 2 |
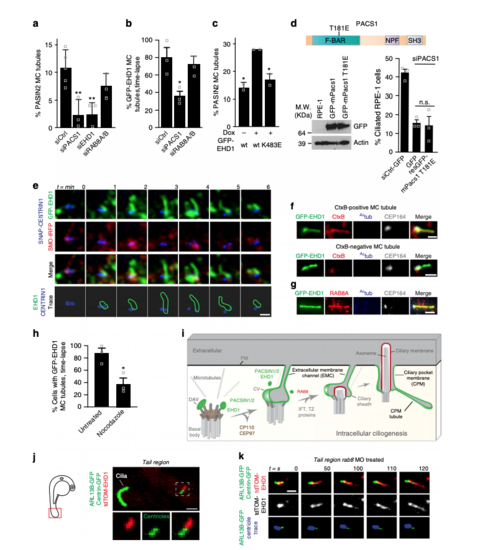
MC-membrane tubules are PACSIN1-, EHD1- and MT-dependent and form in vivo. aQuantification of PACSIN2 positive MC-tubules in cells as in Fig. 6c following siRNAs treatments (siCtrl = 258 cells, n = 5; siPACS1 = 168, siEHD1 = 75, siRAB8A/B = 147 cells, n = 3). b Quantification of GFP-EHD1-positive MC-tubules from triple line treated with siRNAs, starved 3 h and imaged every 2 min for 30 min (siCtrl = 35, siPACS1 = 36, siRAB8A/B = 57 cells, n = 3). c Quantification of MC-tubules from cell lines starved for 3 h and stained with PACSIN2 and CEP164 antibodies (wt −dox = 262, wt +dox = 142, K483E +dox = 177 cells, n = 2). d Schematic of the T181E tubulation defective mutation in the F-BAR domain of mPacsin1 (top). Immunoblot analysis of cells transfected with wildtype- or T181E-mPacsin1 after 6 h of siRNA treatment (bottom left) and ciliation rescue experiment (bottom right, siCtrl = 108, GFP = 71, rescT181E = 85 cells, n = 3). e Images of the 3 h starved triple line taken every minute. Membrane tubules are outlined in green and centrioles in blue (bottom panel, 15 MC-tubules). Single xy planes were smoothed. f Single plane xy epifluorescence images of 3 h starved GFP-EHD1 cells that were CtxB positive (~5% of cells). 53% of GFP-EHD1 MC-tubules contained CtxB (12 MC-tubules). g Images of GFP-EHD1 cells as in f stained with RAB8A, Actub, and CEP164 antibodies (10 cells). Scale bars: 1 μm in (e-g). hQuantification of cells as in b treated with 10 μM Nocodazole (untreated = 38, Nocodazole = 40 cells, n = 3). i Model for intracellular ciliogenesis. DAV distal appendage vesicle, CV ciliary vesicle, IFT intraflagellar transport, TZ transition zone, PM plasma membrane. In a–d and h, means ± SEM and two-tailed t-test analyses are indicated in figure. *P < 0.05, **P < 0.001, non significant (n.s). j Live image of the tail (red box, left schematic) from a 24 hpf embryo showing a tdTom-EHD1 positive MC-tubule (white box, 9 MC-tubules). k Timelapse of MC-tubule formation (centrioles in blue) as in j from embryo injected with rab8 MO (11 MC-tubules). Scale bars: 2 μm in j and k |
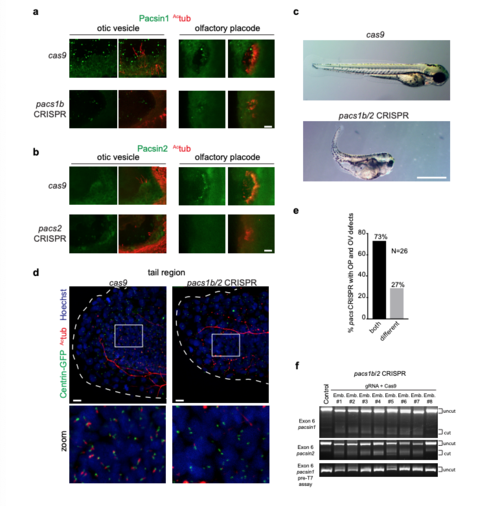
Pascin expression and CRISPR knockdowns in zebrafish embryos. (a, b) Images of otic vesicles and olfactory placodes in Cas9-injected, pacsin1b (a) or pacsin2 (b) CRISPR embryos at 3 dpf stained with Actub and Pacsin1 or Pacsin2 antibodies. Images were taken using identical settings to compare protein expression levels in Cas9-injected versus mutant tissues. Gene targeting specificity of CRISPR treatments was confirmed by observed reductions in fluorescence intensity for Pacsin proteins. Scale bars: 10 μm. (c) Brightfield images of 3 dpf zebrafish embryos injected as described in Fig. 1f-j. Note the presence of body curvature, small eye, and hydrocephalus phenotypes. Scale bar: 1 mm. (d) Images of ciliated cells from tails of 24hpf Tg(Centrin: GFP) embryos injected with CRISRP pacs1b/2 gRNA+ Cas9 RNA or Cas9 RNA only and stained with Actub and Hoechst. Scale bar: 10μm. (e) Quantification of phenotypical mosaicism in 3 dpf pacsin CRISPR embryos from Fig. 1f-j. Note that 73% of embryos presented both OV and OP defects simultaneously (n=26 embryos). Only embryos with both organs visible were quantified in this experiment. (f) At 3dpf, control (lane1) and 8 randomly selected pacs1b/2 gRNA injected F0 embryos (lane 2-10) were subjected to T7EI assay. The T7EI fragments are indicated as “cut” and wild type are noted as “uncut’ . Note that the majority of pacsin gRNA injected embryos harbored indels and presented a reduction in wildtype fragments suggesting a high mutagenesis rate at the pacsin targets. PHENOTYPE:
|