
|
Fig. S2
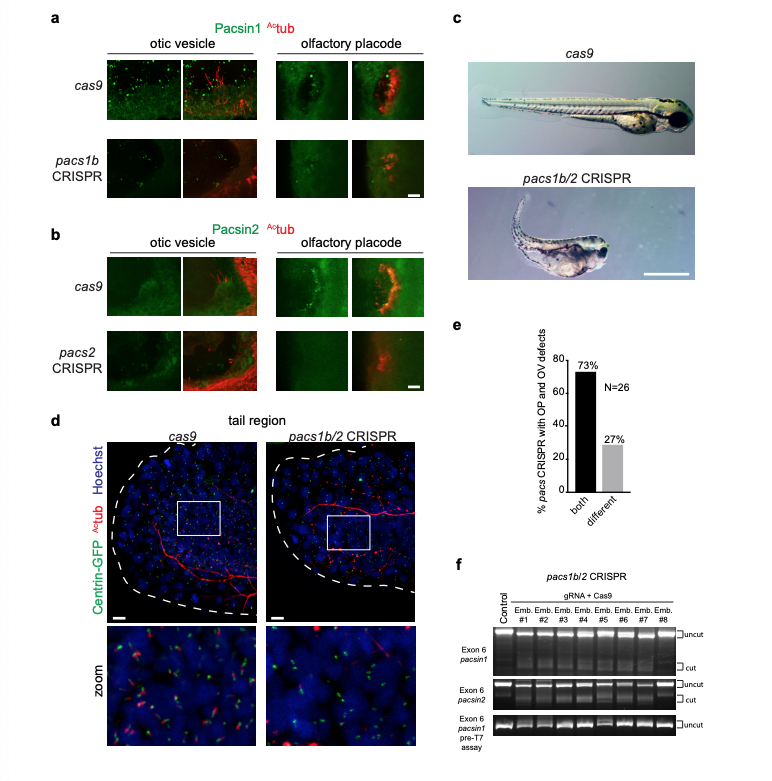
Pascin expression and CRISPR knockdowns in zebrafish embryos. (a, b) Images of otic vesicles and olfactory placodes in Cas9-injected, pacsin1b (a) or pacsin2 (b) CRISPR embryos at 3 dpf stained with Actub and Pacsin1 or Pacsin2 antibodies. Images were taken using identical settings to compare protein expression levels in Cas9-injected versus mutant tissues. Gene targeting specificity of CRISPR treatments was confirmed by observed reductions in fluorescence intensity for Pacsin proteins. Scale bars: 10 μm. (c) Brightfield images of 3 dpf zebrafish embryos injected as described in Fig. 1f-j. Note the presence of body curvature, small eye, and hydrocephalus phenotypes. Scale bar: 1 mm. (d) Images of ciliated cells from tails of 24hpf Tg(Centrin: GFP) embryos injected with CRISRP pacs1b/2 gRNA+ Cas9 RNA or Cas9 RNA only and stained with Actub and Hoechst. Scale bar: 10μm. (e) Quantification of phenotypical mosaicism in 3 dpf pacsin CRISPR embryos from Fig. 1f-j. Note that 73% of embryos presented both OV and OP defects simultaneously (n=26 embryos). Only embryos with both organs visible were quantified in this experiment. (f) At 3dpf, control (lane1) and 8 randomly selected pacs1b/2 gRNA injected F0 embryos (lane 2-10) were subjected to T7EI assay. The T7EI fragments are indicated as “cut” and wild type are noted as “uncut’ . Note that the majority of pacsin gRNA injected embryos harbored indels and presented a reduction in wildtype fragments suggesting a high mutagenesis rate at the pacsin targets.