
Fig. 4
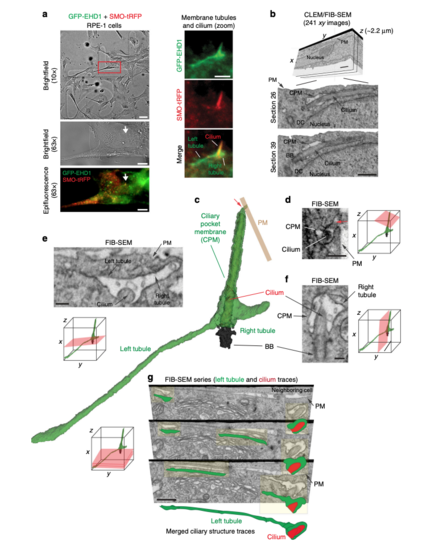
Three-dimensional FIB-SEM analysis shows membrane tubules connected to the CPM. aBrightfield and epifluorescence images of serum starved GFP-EHD1 + SMO-tRFP cells with membrane tubules associated with the cilium. Left panels show brightfield and fluorescence images at 10× and 63× used to identify the position of the ciliated cell on an alphanumerical grid for CLEM/FIB-SEM analysis (red box in top panel). Right panels show a 63× zoom of the cilium and associated membrane tubules (white arrow in the left panels). Scale bars: left top panel: 50 μm, left middle and bottom panels: 10 μm, right panels: 2 μm. b FIB-SEM image stack of the cell in a. Top panel shows a volume view of 241 xy plane FIB-SEM images (1102 × 472 pixels; 9 nm pixel size) with a cell depth (z) of ~2.2 μm (top panel). Middle and bottom panels show cropped FIB-SEM images of xy sections 26 and 39 with the cilium, CPM, basal body (BB), and daughter centriole (DC). Scale bars: 1 μm. The raw FIB-SEM image stack for the ciliary structures is available in Supplemental Movie 2. c 3D segmentation analysis of the FIB-SEM images in b using 3DSlicer software. Cilium (red), BB (black), CPM connected to the PM (red arrow) and the left and right CPM tubules (green). d–f FIB-SEM images showing the connection of the CPM with the PM (d, red arrow), transverse (e), and longitudinal (f) sections of the cilium from b. e, f show a shorter tubule (right tubule) and a longer tubule (left tubule), both attached to the CPM. Scale bars: 500 nm (d), 200 nm (e, f). g Representative FIB-SEM images (top three panels) from b showing the continuous left tubule connected to the CPM. Traces for the cilium (red) and the left tubule (green) are shown offset from FIB-SEM structures (yellow highlights) and merged in the bottom panel. Scale bar: 1 μm. d–g Orientation (red planar sheets) of the FIB-SEM images is indicated in the xyz model. b, d–g Images were generated with IMOD. CPM membrane tubules were observed by CLEM/FIB-SEM (2 cells) |