
|
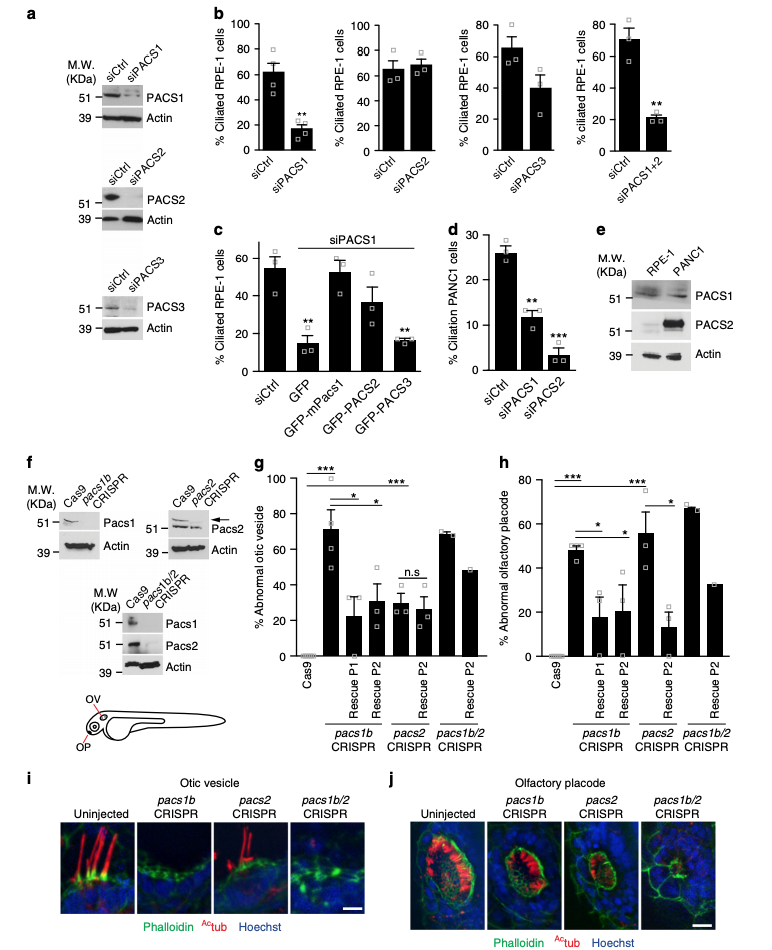
Fig. 1
PACSIN1 and -2 are required for ciliogenesis. a Western analysis of PACSINs depletion in RPE-1 cells treated with siCtrl or siPACSINs (sequences in Supplementary Table 1). bQuantification of ciliated cells treated as in a (n = 4 independent experiments, siCtrl = 801, siPACS1 = 543 cells in total; n = 3, Ctrl = 215, siPACS2 = 128 cells; n = 3, siCtrl = 107, siPACS3 = 85 cells; n = 3, siCtrl = 106, siPACS1+2 = 75 cells). Images are in Supplementary Figure 1a. cQuantification of ciliation in RPE-1 cells treated with siPACSIN1 for 6 h, rescued with indicated constructs and starved at 48 hpf (n = 3, siCtrl = 108, GFP = 71, GFP-mPacs1 = 39, GFP-PACS2 = 75, GFP-PACS3 = 55 cells). d Quantification of ciliation in PANC1 cells treated as in b (n = 3, siCtrl = 273, siPACS1 = 194, siPACS2 = 175 cells). e Western analysis of PACSINs expression in RPE-1 and PANC1 cells. f Western analysis of Pacsins expression in 3 days post fertilization (dpf) CRISPR mutants (gRNA sequences shown in Supplementary Table 1). Arrow indicates Pacsin2 band. Schematic of organs of interest (Otic vesicle: OV, and Olfactory placode: OP). g Quantification of abnormal OV from embryos as in f and rescued with human PACSIN RNAs. Cas9, 38 OVs, n = 5; pacs1bCRISPR, 37 OVs, n = 4; pacs1bCRISPR + hPACSIN1, 20 OVs, n = 3; pacs1bCRISPR + hPACSIN2, 16 OVs, n = 3; pacs2CRISPR, 23 OVs, n = 3; pacs2CRISPR + hPACSIN2, 20 OVs, n = 3; pacs1b/2CRISPR, 15 OVs, n = 2; pacs1b/2CRISPR + hPACSIN2, 5 OVs, n = 1. Images are shown in (i) (scale bar: 5 μm). h Quantification of abnormal OP in embryos injected as in g. Cas9, 37 OPs, n = 5; pacs1bCRISPR, 25 OPs, n = 4; pacs1bCRISPR + hPACSIN1, 17 OPs, n = 3; pacs1bCRISPR + hPACSIN2, 14 OPs, n = 3; pacs2CRISPR, 18 OPs, n = 3; pacs2CRISPR + hPACSIN2, 19 OPs, n = 3; pacs1b/2CRISPR, 15 OPs, n = 2; pacs1b/2CRISPR + hPACSIN2, 6 OPs, n = 1. Images are shown in j (scale bar: 10 μm). Images in i and j are maximum intensity projections of deconvolved z-stacks. Means ± SEM. Two-tailed t-test analyses as compared with siCtrl in b and d or as indicated in figure. *P < 0.05, **P < 0.001, non significant (n.s)