FIGURE SUMMARY
Title

Continuous addition of progenitors forms the cardiac ventricle in zebrafish

Authors
Felker, A., Prummel, K.D., Merks, A.M., Mickoleit, M., Brombacher, E.C., Huisken, J., Panáková, D., Mosimann, C.
Source
Full text @ Nat. Commun.

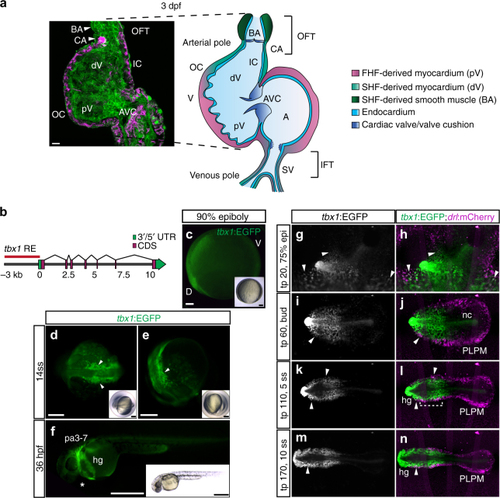
tbx1 reporter expression and lineage contribution in the cardiopharyngeal field and ALPM. a Confocal Z-projection and schematic representation of a 72-hpf zebrafish heart with two chambers, the ventricle (V) and atrium (A) separated by a valve at the atrioventricular canal (AVC). The isolated heart is stained for MHC marking the myocardium (magenta) and a-PKC marking all cells (green). The FHF-assigned myocardium contains the proximal ventricle (pV) and the majority of the atrium (A), SHF-assigned myocardium forms the distal ventricle (dV) and outflow tract (OFT), shown in magenta and green in the schematic, respectively. The OFT includes the conus arteriosus (CA), comprising the myocardial connection of the ventricle to the bulbus arteriosus (BA), and the smooth muscular BA itself. The lineage contributions to the sinus venosus (SV)/inflow tract (IFT) and developmental timing of IFT valve formation remain unresolved. IC: inner curvature, OC: outer curvature. b Genomic locus of the zebrafish tbx1 gene; the red line indicates a 3.2-kb cis-regulatory region amplified to drive reporter transgenics. c Representative tbx1:EGFP reporter transgene expression in a dorsal/anterior field during gastrulation (90% epiboly, dorsal/anterior to the left). d, etbx1:EGFP at 14 ss; dorsal (d) and lateral views (e) of the prospective cardiopharyngeal field (CPF, arrowheads). f Lateral view of a 36-hpf tbx1:EGFP embryo with EGFP expression in the CPF-derived pharyngeal arches (pa3–7) and heart (asterisk). EGFP expression also marks the prechordal mesoderm-derived hatching gland (hg). cf Insets depict bright-field images of the respective fluorescent images. gn Mercator projection of representative stages from panoramic SPIM-imaged tbx1:EGFP;drl:mCherry double-positive transgenic embryos (n = 3); dorsal views. tbx1:EGFP expression is confined to the anterior of the embryo, with no EGFP signal in the posterior LPM (PLPM). Expression in the notochord (nc) and hatching gland (hg) is likely related to early prechordal plate activity of the reporter. Note the double-positive cells at the outermost domain of the tbx1:EGFP-positive anterior cell population (arrowheads and bracket). Scale bars 10 μm (a), 100 μm (c), 200 μm (d, e), and 500 μm (f). gn Anterior to the left

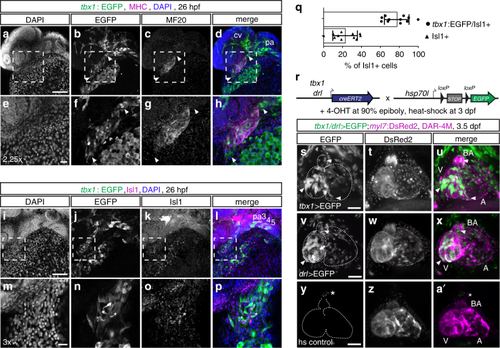
tbx1+ cells contribute to LPM-derived cardiac lineages. ap Representative maximum intensity projections of whole-mount tbx1:EGFP-expressing embryos counterstained for anti-EGFP and anti-MHC (n = 3) (ah) or anti-Isl1 (n = 11) (ip) at 26 hpf; lateral views, anterior to the left. adtbx1 reporter expression can be detected in the MHC-positive linear heart tube and in the MHC-negative poles at the cardiac inflow and outflow tracts (arrowheads); eh depicts a 2.25x magnification of the framed area in ad. tbx1:EGFP also marks the pharyngeal arches (pa) and endothelial cells of the cranial vasculature (cv) (d). iptbx1 reporter-expressing cells at the IFT co-express the SHF marker Isl1 (asterisks n, o); mp depicts a 3x magnification of the framed area in il. q Quantification of tbx1:EGFP/Isl1 double- compared to Isl1 single-positive cells at the IFT of the linear heart tube, n = 11 individual embryos analyzed, means ± s.d. r Lineage tracing of tbx1 and drl reporter-expressing cells, shown in representative embryos. tbx1:creERT2 (n = 11) or drl:creERT2 (n = 3) transgenics, respectively, were crossed to the ubiquitous hsp70l:Switch loxP tracer line, embryos were 4-OHT-induced at 90% epiboly, and heat-shocked at 3 dpf. s-a’ Live SPIM imaging of still hearts of representative lineage-traced and control embryos; maximum intensity projections of ventral views, anterior to the top, dashed outlines mark the heart with the bulbus arteriosus (BA), atrium (A), and ventricle (V). sutbx1:creERT2 lineage tracing (tbx1 > EGFP) at late gastrulation labels myl7:DsRed2-expressing cardiomyocytes (arrowheads) in the ventricle and inflow tract of the atrium, and DAR-4M-stained cells (arrowhead) in the BA. vxdrl:creERT2-mediated lineage tracing (drl > EGFP) at 90% epiboly marks all cardiomyocytes (arrowheads) in the ventricle and atrium, BA cells (arrowhead), and the endocardium (arrows). y-atbx1:creERT2;hsp70l:Switch transgenics without 4-OHT treatment and heat-shocked at 3 dpf show no specific EGFP expression (asterisks mark the autofluorescent pigment cell). Scale bars 20 μm (eh, mp), 100 μm (ad, il, sa’)

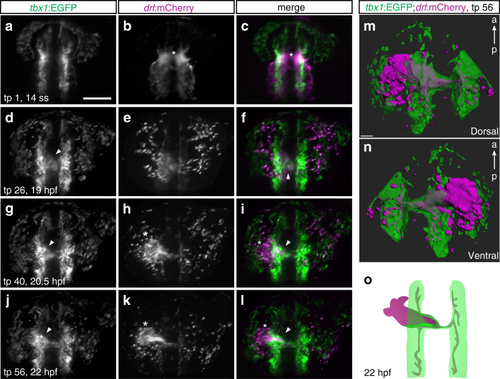
A tbx1+ sheath forms at the base of the FHF-derived heart tube. al Maximum intensity projections of representative stages from SPIM-imaged tbx1:EGFP;drl:mCherry double-positive transgenic embryos; dorsal views, anterior to the top. Imaging was initiated at 14 ss (16 hpf) and cardiac development followed until linear heart tube (LHT) stage (22–23 hpf, n = 3). ac 14 ss stage embryo at the onset of medial FHF migration (asterisk). df The forming cardiac disk already contains tbx1:EGFP-positive cells (arrowhead). gltbx1:EGFP-positive cells (arrowhead in g, i) assemble at the base of the extending drl reporter-expressing heart cone (asterisk in h, k) and are contained in the LHT (arrowhead in j, l), note the absence of tbx1:EGFP reporter-expressing cells at the leading edge (asterisk in k, l) of the forming heart tube. m, n 3D segmentation (dorsal and ventral view) revealing a tbx1 reporter-expressing sheath of cells engulfing the drl reporter-expressing endocardium at 22–23 hpf. o Schematic of tbx1 and drl reporter-expressing cell arrangements at the end of imaging. Scale bars 50 µm (m), 200 µm (al)

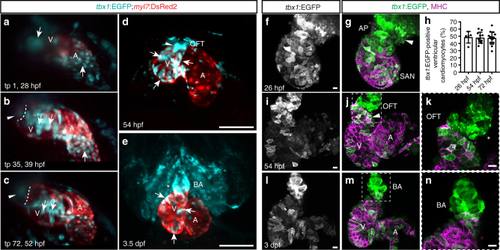
tbx1+ myocardial precursors connect to the FHF myocardium during heart tube stages. ac Maximum intensity projections of representative stages of a high-resolution reconstruction of the beating heart of a tbx1:EGFP;myl7:DsRed2 double-positive transgenic between 28 and 52 hpf; lateral view (right side) of the embryo, anterior to the top, ventricle to the upper left, atrium to the lower right, and cardiac imaging phase 27 (n = 1); ventricle (V), atrium (A), and bulbus arteriosus (BA). Arrows indicate tbx1+/myl7- cells at the OFT and IFT at the beginning of the time-lapse (a) that gradually turn on myl7 reporter expression (b, c). The dashed line (b, c) indicates the distal end of the ventricle and the arrowheads point to tbx1:EGFP-expressing cells at the OFT that never cross into the ventricle and are likely BA precursors. d, e Maximum intensity projections of SPIM-imaged tbx1:EGFP;myl7:DsRed2 double-positive transgenic hearts stopped from contracting with BDM at 54 hpf (n = 3) or 3.5 dpf (n = 7), respectively; ventral views, anterior to the top. tbx1 reporter expression can be detected in differentiated tbx1/myl7 reporter double-positive cardiomyocytes (arrows d, e), the tbx1+/myl7- OFT at 54 hpf (arrowhead d), and the tbx1+/myl7- BA at 3.5 dpf (asterisk e). f, g, in Top-down 2-µm confocal section of isolated zebrafish hearts at 26 (f, g), 54 (ik), and 72 hpf (ln) from tbx1:EGFP, counterstained with anti-GFP and anti-MHC; OFT/BA to the top, sinoatrial node (SAN) or atrium (A) to the bottom left, and ventricle (V) to the top left. k, n A magnification of the framed area in j, m. f, gtbx1:EGFP is expressed at the MHC-negative arterial pole (AP) of the heart tube (arrowhead). h Quantification of the tbx1:EGFP-positive ventricular cardiomyocytes compared to whole ventricle (in percentage) reveals no change over developmental period from 26 hpf (n = 5), 54 hpf (n = 11), to 72 hpf (n = 15). Each data point represents averaged percentage per heart; means ± s.d. ik At 54 hpf, cardiomyocytes of the later-differentiated distal ventricle express tbx1:EGFP (arrowhead), as do MHC-negative progenitors of the OFT (asterisks). ln The differentiated BA at 3 dpf is positive for tbx1:EGFP. Scale bars 200 µm (d, e), 10 µm (f, g, in)

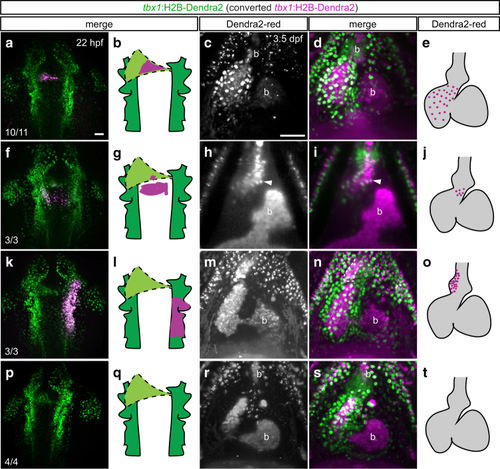
The tbx1+ cone forms the ventricular myocardium but not the BA. a, f, k, p Maximum intensity projections and schematics of representative photoconverted (a, f, k) or control (p) tbx1:Dendra2 embryos; dorsal views, anterior to the top. At 22 hpf, tbx1:Dendra2-expressing embryos were illuminated with a 405-nm laser in a confined region of interest to convert Dendra2-green to Dendra2-red in specific tbx1 reporter-expressing domains. c, h, m, r SPIM-imaged hearts and graphical representations of embryos photoconverted as in a, f, k and p and stopped from contracting with BDM at 3.5 dpf; maximum intensity projections (c, d, m, n, r, s) or optical Z-section (h, i), ventral views, anterior to the top. ae Dendra2-red-positive sheath cells give rise to ventricular cardiomyocytes, including the SHF-derived distal ventricle, but not to the BA. The red signal within the BA (b) derives from autofluorescent blood also detected in non-photoconverted tbx1:Dendra2 embryos (see pt). fj Medial migrating cells posterior to the cardiac cone contribute to the most distal myocardium at the dorsal side of the heart (arrowhead in h, i) and to a proximal portion of the BA in 3/3 analyzed embryos. ko Photoconversion of a broad area in the tbx1:Dendra2-positive pharyngeal ALPM posterior to and on the right of the linear heart tube marks the right side of the BA (dotted outline in n). pt Red signals in the chambers and on top of the pericardium are due to unspecific autofluorescence also detected in controls. Scale bars 50 µm

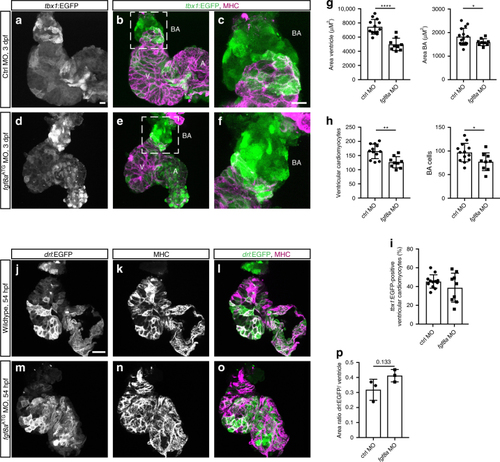
fgf8a knockdown leads to perturbed ventricle and BA formation. af Top-down 7-μm confocal section of wild-type control (ac) and fgf8aATG morphant (df) hearts at 3 dpf. tbx1:EGFP, counterstained with anti-GFP labels the bulbus arteriosus (BA) and scattered ventricular (V) and atrial (A) cardiomyocytes, counterstained with anti-MHC. c, f depicts a magnification of the framed area in b and e. g Quantification of the ventricular (n = 13) and BA area (n = 15) in control morpholino (ctrl MO)-injected hearts compared to fgf8aATG morphant hearts (n = 9) reveals that both ventricle and BA are significantly smaller upon fgf8a knockdown (****P < 0.0001, *P = 0.0406). Each data point represents the averaged ventricular or BA area from one heart. h Quantification of the cell number of ventricular cardiomyocytes and the BA cells in ctrl MO hearts (n = 12) compared to fgf8aATG morphant hearts (n = 9) displays significantly less cells in both ventricle and BA upon loss of fgf8a (**P = 0.001, *P = 0.0305). Each data point represents the total number of nuclei per region from one heart. i Quantification of the tbx1:EGFP-positive ventricular cardiomyocytes compared to whole ventricle (in percentage) in ctrl MO hearts (n = 12) and fgf8aATG morphant hearts (n = 9) shows no difference (P = 0.2603). jo Top-down 3-μm confocal sections of wild-type control (jl) and fgf8aATG morphant (mo) hearts at 54 hpf. drl:EGFP counterstained with anti-GFP labels FHF-derived cardiomyocytes co-marked by anti-MHC. p The ratio between the area of drl:EGFP-positive cells and the area of the entire ventricle is not significantly different comparing controls and fgf8aATG morphants (P = 0.133). Each data point presents the calculated ratio from one heart. Means ± s.d. ****P ≤ 0.0001, unpaired t-test with Welch correction. Scale bars 10 µm

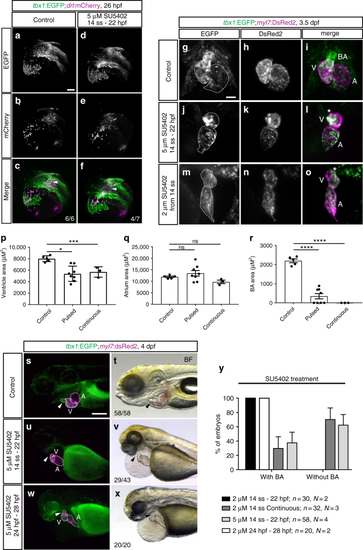
FGF signaling differentially affects tbx1+ ventricular and BA precursors. af Maximum intensity projections of representative tbx1:EGFP;drl:mCherry DMSO-treated controls or embryos treated with 5 µM SU5402 from 14 ss to 22 hpf; lateral/dorsal view, anterior to the left. FGF signaling-perturbed embryos show a defect in the tbx1:EGFP-expressing sheath (arrowhead) at the base of the forming heart tube (outline). go Maximum intensity projections of representative hearts of tbx1:EGFP;myl7:DsRed2 embryos, DMSO-treated controls (gi, n = 5), treated with 5 µM SU5402 between 14 ss and 24 hpf (jl, n = 8), or treated with 2 µM SU5402 continuously from 14 ss (mo, n = 3); ventral views, anterior to the top, outlines mark the heart. FGF-perturbed embryos retain normal contribution of tbx1:EGFP-expressing cardiomyocytes to the ventricle upon pulsed or continuous signaling inhibition; ventricle (V), atrium (A), bulbus arteriosus (BA), and asterisks mark the missing BA upon SU5402 treatments. pr Quantified ventricle, atrium, and BA area size in SU5402-treated embryos as in go. Pulsed (see jl) or continuous (see mo) FGF signaling inhibition diminishes ventricle size (p) and severely reduced to abolished addition of the tbx1 reporter-expressing BA (r). The atrium is not significantly affected (q). Means ± SEM. ns P > 0.05, *P ≤ 0.05, **P ≤ 0.01, ***P ≤ 0.001, and ****P ≤ 0.0001, unpaired t-test with Welch correction. sy SU5402 treatments affect BA development in time- and concentration-dependent manner; n indicates the number of embryos analyzed per condition, N indicates the number of experiments performed. sxtbx1:EGFP;myl7:DsRed transgenic controls and embryos treated with DMSO or 5 µM SU5402 during (14 ss–22 hpf) or after (24 hp–28 hpf) heart tube formation; lateral views, anterior to the left. Absent BA formation can only be observed in embryos treated with SU5402 from mid-somitogenesis to heart tube stages (arrowhead in u, v, compare to s, t), but not when signaling inhibition is initiated at 24 hpf (arrowhead in w, x). y Quantification of the concentration-dependent effect on BA formation in FGF signaling-perturbed tbx1:EGFP;myl7:Red or DAR-4M-stained myl7:EGFP transgenics (see Supplementary Fig. 7). For 5 µM SU5402 from 14 ss to 22 hpf, no BA in n = 29/43 as assessed by tbx1 reporter and n = 5/15 by DAR-4M, total n = 34/58, N = 4; DMSO-treated controls: normal BA in n = 58/58 by tbx1 reporter and n = 10/10 by DAR-4M, total n = 68/68, N = 4. Scale bars 50 µm (g, o), 100 μm (af, sx)

Acknowledgments
This image is the copyrighted work of the attributed author or publisher, and ZFIN has permission only to display this image to its users. Additional permissions should be obtained from the applicable author or publisher of the image. Full text @ Nat. Commun.