IMAGE

Fig. 4

ID
ZDB-IMAGE-190723-1907
Source
Figures for Felker et al., 2018
Image
Figure Caption

Fig. 4

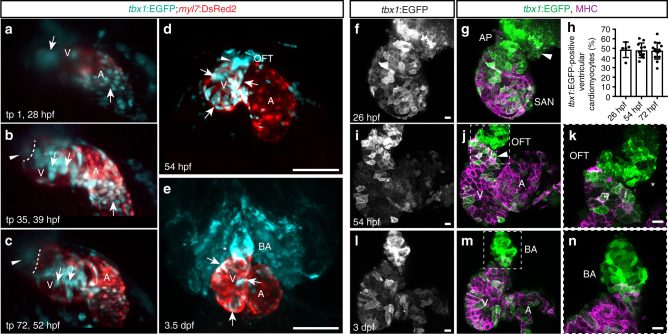
tbx1+ myocardial precursors connect to the FHF myocardium during heart tube stages. ac Maximum intensity projections of representative stages of a high-resolution reconstruction of the beating heart of a tbx1:EGFP;myl7:DsRed2 double-positive transgenic between 28 and 52 hpf; lateral view (right side) of the embryo, anterior to the top, ventricle to the upper left, atrium to the lower right, and cardiac imaging phase 27 (n = 1); ventricle (V), atrium (A), and bulbus arteriosus (BA). Arrows indicate tbx1+/myl7- cells at the OFT and IFT at the beginning of the time-lapse (a) that gradually turn on myl7 reporter expression (b, c). The dashed line (b, c) indicates the distal end of the ventricle and the arrowheads point to tbx1:EGFP-expressing cells at the OFT that never cross into the ventricle and are likely BA precursors. d, e Maximum intensity projections of SPIM-imaged tbx1:EGFP;myl7:DsRed2 double-positive transgenic hearts stopped from contracting with BDM at 54 hpf (n = 3) or 3.5 dpf (n = 7), respectively; ventral views, anterior to the top. tbx1 reporter expression can be detected in differentiated tbx1/myl7 reporter double-positive cardiomyocytes (arrows d, e), the tbx1+/myl7- OFT at 54 hpf (arrowhead d), and the tbx1+/myl7- BA at 3.5 dpf (asterisk e). f, g, in Top-down 2-µm confocal section of isolated zebrafish hearts at 26 (f, g), 54 (ik), and 72 hpf (ln) from tbx1:EGFP, counterstained with anti-GFP and anti-MHC; OFT/BA to the top, sinoatrial node (SAN) or atrium (A) to the bottom left, and ventricle (V) to the top left. k, n A magnification of the framed area in j, m. f, gtbx1:EGFP is expressed at the MHC-negative arterial pole (AP) of the heart tube (arrowhead). h Quantification of the tbx1:EGFP-positive ventricular cardiomyocytes compared to whole ventricle (in percentage) reveals no change over developmental period from 26 hpf (n = 5), 54 hpf (n = 11), to 72 hpf (n = 15). Each data point represents averaged percentage per heart; means ± s.d. ik At 54 hpf, cardiomyocytes of the later-differentiated distal ventricle express tbx1:EGFP (arrowhead), as do MHC-negative progenitors of the OFT (asterisks). ln The differentiated BA at 3 dpf is positive for tbx1:EGFP. Scale bars 200 µm (d, e), 10 µm (f, g, in)

Acknowledgments
This image is the copyrighted work of the attributed author or publisher, and ZFIN has permission only to display this image to its users. Additional permissions should be obtained from the applicable author or publisher of the image. Full text @ Nat. Commun.