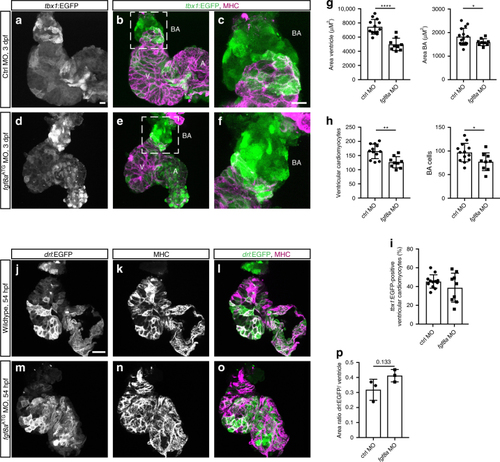
fgf8a knockdown leads to perturbed ventricle and BA formation. a–f Top-down 7-μm confocal section of wild-type control (a–c) and fgf8aATG morphant (d–f) hearts at 3 dpf. tbx1:EGFP, counterstained with anti-GFP labels the bulbus arteriosus (BA) and scattered ventricular (V) and atrial (A) cardiomyocytes, counterstained with anti-MHC. c, f depicts a magnification of the framed area in b and e. g Quantification of the ventricular (n = 13) and BA area (n = 15) in control morpholino (ctrl MO)-injected hearts compared to fgf8aATG morphant hearts (n = 9) reveals that both ventricle and BA are significantly smaller upon fgf8a knockdown (****P < 0.0001, *P = 0.0406). Each data point represents the averaged ventricular or BA area from one heart. h Quantification of the cell number of ventricular cardiomyocytes and the BA cells in ctrl MO hearts (n = 12) compared to fgf8aATG morphant hearts (n = 9) displays significantly less cells in both ventricle and BA upon loss of fgf8a (**P = 0.001, *P = 0.0305). Each data point represents the total number of nuclei per region from one heart. i Quantification of the tbx1:EGFP-positive ventricular cardiomyocytes compared to whole ventricle (in percentage) in ctrl MO hearts (n = 12) and fgf8aATG morphant hearts (n = 9) shows no difference (P = 0.2603). j–o Top-down 3-μm confocal sections of wild-type control (j–l) and fgf8aATG morphant (m–o) hearts at 54 hpf. drl:EGFP counterstained with anti-GFP labels FHF-derived cardiomyocytes co-marked by anti-MHC. p The ratio between the area of drl:EGFP-positive cells and the area of the entire ventricle is not significantly different comparing controls and fgf8aATG morphants (P = 0.133). Each data point presents the calculated ratio from one heart. Means ± s.d. ****P ≤ 0.0001, unpaired t-test with Welch correction. Scale bars 10 µm
|
