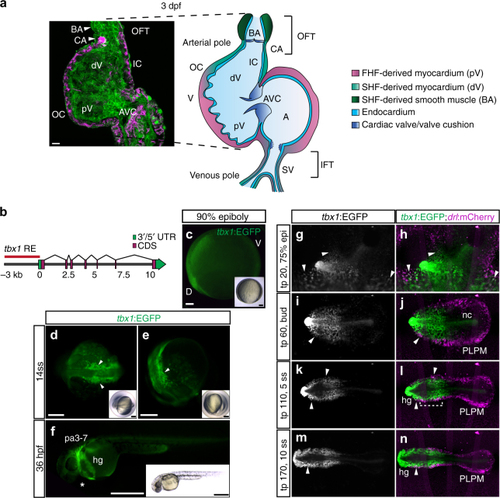
tbx1 reporter expression and lineage contribution in the cardiopharyngeal field and ALPM. a Confocal Z-projection and schematic representation of a 72-hpf zebrafish heart with two chambers, the ventricle (V) and atrium (A) separated by a valve at the atrioventricular canal (AVC). The isolated heart is stained for MHC marking the myocardium (magenta) and a-PKC marking all cells (green). The FHF-assigned myocardium contains the proximal ventricle (pV) and the majority of the atrium (A), SHF-assigned myocardium forms the distal ventricle (dV) and outflow tract (OFT), shown in magenta and green in the schematic, respectively. The OFT includes the conus arteriosus (CA), comprising the myocardial connection of the ventricle to the bulbus arteriosus (BA), and the smooth muscular BA itself. The lineage contributions to the sinus venosus (SV)/inflow tract (IFT) and developmental timing of IFT valve formation remain unresolved. IC: inner curvature, OC: outer curvature. b Genomic locus of the zebrafish tbx1 gene; the red line indicates a 3.2-kb cis-regulatory region amplified to drive reporter transgenics. c Representative tbx1:EGFP reporter transgene expression in a dorsal/anterior field during gastrulation (90% epiboly, dorsal/anterior to the left). d, etbx1:EGFP at 14 ss; dorsal (d) and lateral views (e) of the prospective cardiopharyngeal field (CPF, arrowheads). f Lateral view of a 36-hpf tbx1:EGFP embryo with EGFP expression in the CPF-derived pharyngeal arches (pa3–7) and heart (asterisk). EGFP expression also marks the prechordal mesoderm-derived hatching gland (hg). c–f Insets depict bright-field images of the respective fluorescent images. g–n Mercator projection of representative stages from panoramic SPIM-imaged tbx1:EGFP;drl:mCherry double-positive transgenic embryos (n = 3); dorsal views. tbx1:EGFP expression is confined to the anterior of the embryo, with no EGFP signal in the posterior LPM (PLPM). Expression in the notochord (nc) and hatching gland (hg) is likely related to early prechordal plate activity of the reporter. Note the double-positive cells at the outermost domain of the tbx1:EGFP-positive anterior cell population (arrowheads and bracket). Scale bars 10 μm (a), 100 μm (c), 200 μm (d, e), and 500 μm (f). g–n Anterior to the left
|