- Title
-
Diet-Induced Growth Is Regulated via Acquired Leptin Resistance and Engages a Pomc-Somatostatin-Growth Hormone Circuit
- Authors
- Löhr, H., Hess, S., Pereira, M.M.A., Reinoß, P., Leibold, S., Schenkel, C., Wunderlich, C.M., Kloppenburg, P., Brüning, J.C., Hammerschmidt, M.
- Source
- Full text @ Cell Rep.
|
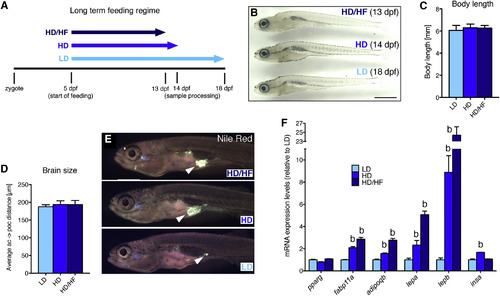
Effects of Long-Term Caloric Excess on Linear Growth and Lipid Metabolism in Larval Zebrafish (A) Feeding paradigm for generation of size-matched zebrafish larvae with different caloric energy input (see text for details). Samples were collected at a standard body length of 6 mm at 13 dpf (HD/HF), 14 dpf (HD), and 18 dpf (LD). (B) Lateral view of treated larvae. (C and D) Quantification of body length (n = 20 for each group) (C) and distance between anterior and postoptic commissures as a measure for brain size (D) in pomca:EGFPras transgenic fish (see Figure 3; n = 10). (E) Nile red staining of visceral lipids (arrowheads). (F) qRT-PCR analyses of mRNA levels for pparg, fabp11a, adipoqb, lepa, lepb, and insa. Scale bar in (B) represents 1 mm. b, p < 0.01 relative to respective LD groups (F). Error bars in (C), (D), and (F) show SD. |
|
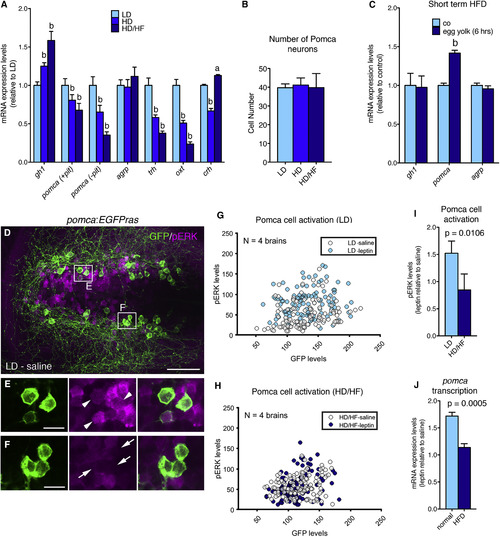
Long-Term Overfeeding Causes Leptin Resistance and Has an Impact on Both the Melanocortin and GH Systems (A) qRT-PCR analyses of mRNA levels for gh1, pomca, agrp, trh, oxt, and crh. Corticotropin-releasing hormone (Dhillo et al., 2002) (crh) was downregulated in the HD group, but not in the HD/HF group, possibly pointing to stress responses caused by incubation in egg yolk medium. To specifically assess hypothalamic pomca expression levels, the pituitary was removed in pomca (?pit). (B) Number of Pomca neurons in three feeding groups as determined by anti-GFP IF and cell counts in pomca:EGFPras fish (see Figure 3; n = 10). (C) mRNA levels of gh1, pomca, and agrp after short-term application of egg yolk to 14 dpf larvae. (D?F) IF for GFP and pERK on an exemplary pomca:EGPras transgenic larval brain (see Figure 3) subjected to the LD feeding regimen and incubated in saline. (D) Overview of hypothalamic regions with GFP+/pERK+ domains. (E and F) Magnification of areas boxed in (D) revealing GFP+/pERK+ cells (E, arrowheads) and GFP+/pERK- cells (F, arrows). (G?I) pERK and GFP levels in Pomca neurons of size-matched LD (G) and HD/HF (H) pomca:EGFPras larvae treated for 30 min with saline or leptin (n = 4 for each condition), and quantification of normalized values (I). (J) Relative pomca mRNA levels in juveniles subjected to normal feeding (n = 8) or high-fat diet (HFD; n = 7) for 10 days, 4 hr after ICV injection of recombinant leptin, determined via qRT-PCR normalized against saline-injected controls. Scale bars represent 50 ?m (D) and 10 ?m (E and F). a, p < 0.05; b, p < 0.01 relative to respective LD groups (A and C). Error bars in (A)?(C), (I), and (J) show SD. |
|
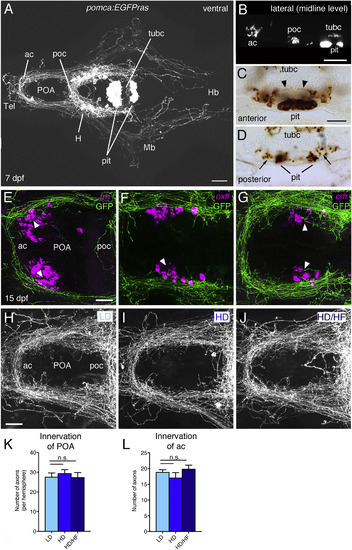
Analysis of Pomca Circuitry Reveals Sparse Pituitary Innervation by Pomca Axons and Unaltered POA Innervation after Excessive Feeding (A?D) Anti-GFP IF (A and B) or immunohistochemistry(IHC) (C and D) on transgenic pomca:EGFPras larvae at 7 dpf. (A) Cell bodies and projections of Pomca neurons in the hypothalamus (H) and pomca+ pituicytes (pit) in the adenohypophysis are labeled. Pomca neurons project to telencephalon (Tel), preoptic area (POA), midbrain (Mb), and hindbrain (Hb). (B) Optical sagittal section at the level of the midline depicting Pomca axons crossing the anterior (ac), postoptic (poc), and the posterior tuberculum commissure (tubc) dorsal to the pituitary. (C and D) Cross sections at anterior (C) and posterior (D) levels of the pituitary; Pomca axons are dorsal (arrowheads; entering neurohypophysis) or lateral (arrows) of the Pomca pituicytes of the adenohypophysis (pit). (E?G) Fluorescent in situ hybridization (ISH) for trh (E), oxt (F), and crh (G) neurons in the POA (arrowheads) combined with anti-GFP IF in pomca:EGFPras larvae at 15 dpf. (H?L) Unaltered POA innervation in pomca:EGFPras larvae subjected to LD (H), HD (I), or HD/HF (J) treatments, revealed by anti-GFP IF and subsequent quantification of axon number in the POA (K; n = 5) or anterior commissure (ac; L; n = 5). Scale bars represent 100 ?m (A and B), 50 ?m (C and D), and 25 ?m (E?J); n.s., not significant. Error bars in (K) and (L) show SD. |
|
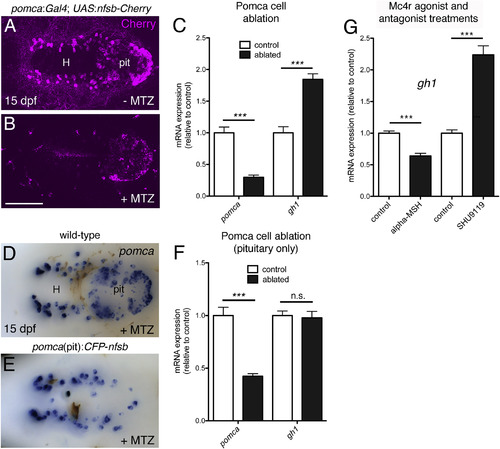
Pomca/?MSH Has a Negative Effect on gh1 Expression (A?C) Ablation of Pomca cells in hypothalamus and pituitary. Anti-RFP IF in pomca:KaITA4;UAS:nfsb-Cherry double transgenic larvae (15 dpf) without (A) or with MTZ treatment (B). (C) qRT-PCR analysis on pomca:KaITA4 single transgenic larvae (control) compared to pomca:KaITA4;UAS:nfsb-Cherry double transgenic larvae (ablated) after 48-hr MTZ treatment revealing reduction of pomca (pointing to an ablation efficacy of ?75%) and elevation of gh1 transcript levels. (D?F) Pituitary specific ablation of Pomca cells. pomca ISH on MTZ-treated wild-type (D) and pomca(pit):CFP-nfsb transgenic (E) larvae at 15 dpf. (F) Selective loss of pomca in the pituitary results in decreased pomca levels but does not affect gh1 expression as assessed by qRT-PCR. Abbreviations: pit, pituitary; H, hypothalamus. (G) qRT-PCR analysis of gh1 levels after treatment of 14 dpf zebrafish larvae with ?MSH or SHU9119. Ventral views are shown in (A), (B), (D), and (E). Scale bars represent 100 ?m (A, B, D, and E); ???p < 0.001; n.s., not significant. Error bars in (C), (F), and (G) show SD. |
|
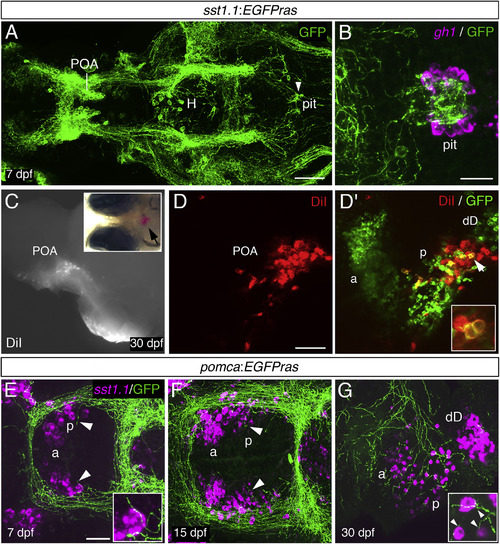
Sst1.1-Neurons of a Posterior POA Domain Project to Pituitary Somatotropes and Are Innervated by Pomca Cell Axons (A) Anti-GFP IF on an sst1.1:EGFPras transgenic larva at 7 dpf. GFP+ axons innervating the pituitary (pit) are indicated by an arrowhead. H, hypothalamus; POA, preoptic area. (B) gh1 ISH (magenta) co-stained via anti-GFP IF (green) at 7 dpf reveals extensive innervation of the gh1 domain in the adenohypophysis by GFP+ Sst1.1 axons. (C?D?) Placement of DiI crystals into the pituitary of sst1.1:EGFPras fish at 30 dpf (C) retrogradely labels cell bodies in the POA (see arrowhead in inset for position of DiI). (D and D?) Within the POA, the posterior (p), but not the anterior (a) Sst1.1-cell domain, contains DiI+ cells. (D?, inset) Magnification of the region labeled by the arrowhead. Additional Sst1.1 cells (dD) are located outside the POA. (E?G) sst1.1 ISH combined with anti-GFP IF in pomca:EGFPras transgenic at 7 dpf (E), 15 dpf (F), and 30 dpf (G) showing innervation of the posterior Sst1.1 POA domain by Pomca-cell axons at all examined stages (see arrowheads and magnifications). Scale bars represent 100 ?m (A), 25 ?m (B, E, and F), and 50 ?m (D and G). Ventral views are shown in (A), (B), (E), and (F), and lateral views are shown in (C)?(D?) and (G). |
|
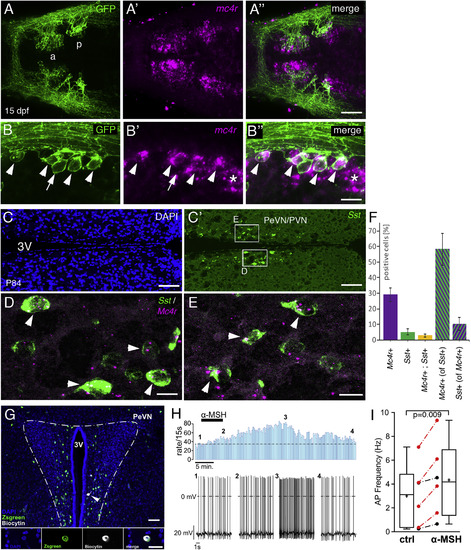
Hypophysiotropic Sst Neurons in Zebrafish and Mouse Express mc4r Transcript and Respond to ?MSH in Mouse (A?B??) sst1.1:EGFPras transgenic zebrafish at 15 dpf, stained via anti-GFP IF (green; [A] and [B]) in combination with mc4r ISH (magenta; [A?] and [B?]). Merged images are shown in (A??) and (B??). (A?A??) Overview of the POA showing mc4r+ cells in Sst1.1+ neurons of anterior (a) and posterior (p) POA clusters. (B?B??) Magnification of the posterior POA domain revealing expression of mc4r by most GFP+ cells (arrowheads, mc4r+,sst1+; arrow, mc4r?,sst1+; asterisk, mc4r+,sst1?). (C?E) ISH for Sst (green; [C?]?[E]) and Mc4r (red; [D] and [E]) on sections of P84 mouse brains, counterstained with DAPI (nuclei, blue; [C]). (C and C?) Overview of the PeVN/PVN hypothalamic region containing hypopyhsiotropic Sst cells. (D and E) Magnification of boxed areas in (C?). Mc4r+ Sst neurons are marked by arrowheads. (F) Quantification of Mc4r+ and Sst+ cells relative to total cell number (DAPI+), and quantification of Mc4r+ cells relative to Sst+ cells and vice versa (in percentage). Error bars show SD. Scale bars represent 50 ?m (A??), 25 ?m (B??), 100 ?m (C and C?), and 15 ?m (D and E). (G?I) ?MSH increases the activity of Sst neurons in the PeVN of SstZsGreen mice. (G) Top: overview of the PeVN (300 ?m brain slice) showing ZsGreen immunofluorescence (green) and the Sst neuron that was labeled with biocytin (white, arrow) during the recording (blue, DAPI). Bottom: higher-magnified view of a single optical section of recorded neuron?s soma showing the DAPI?, Sst?, and biocytin label separately and merged (from left to right). Scale bars: overview, 50 ?m; details, 20 ?m. ?MSH modulation of single Sst PeVN neuron (H). Firing rates (bin width 15 s) before, during, and after application of 250 nM ?MSH (indicated by bar) (top). Original traces from the recording at indicated time points 1?4 (bottom). Boxplots showing the effect of ?MSH (250 nM, 5?7 min) on the action potential frequency of Sst neurons measured 10 min after onset of ?MSH application (p = 0.009, n = 6, from 5 mice; paired two-tailed t test) (I). Red symbols indicate neurons in which the increase in action potential frequency was larger than 3 × SD of the control, thus defining them as responsive. Whiskers indicate the minimum and maximum, and plus signs and horizontal lines indicate means and medians, respectively; error bars indicate SD. |
|
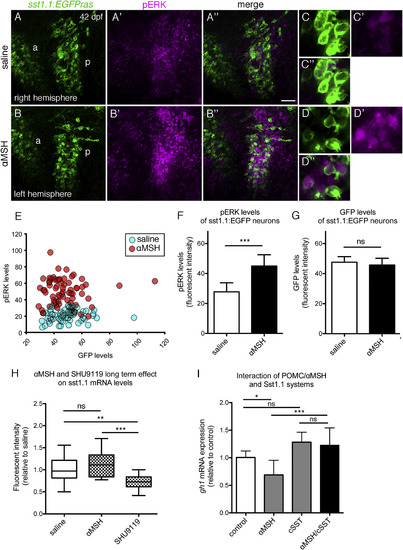
Zebrafish Sst Neurons Respond to ?MSH to Mediate ?MSH?s Effect on GH Expression (A?G) pERK response of hypophysiotropic Sst1.1 cells to ?MSH treatment in sst1.1:EGFPras fish (42 dpf). (A?B??) POA of two hemispheres derived from the same brain, differentially incubated in saline (A?A??) or 10 ?M ?MSH (B?B??) for 30 min. Double IF for GFP (green) and pERK (magenta) reveals increase in pERK levels after ?MSH application in the posterior POA (p). Images of the right hemisphere were flipped horizontally. (C?D??) Magnification of posterior POA Sst1.1 neurons without (C?C??) or with (D?D??) ?MSH treatment. (E?G) Quantification of pERK (E and F) and GFP (E and G) levels in a total of seven brain hemisphere pairs as shown in (A) and (B), revealing significantly increased pERK, but unaltered GFP levels in posterior Sst1.1 neurons after ?MSH treatment. (H) Effect of long-term ?MSH or SHU9119 treatment on sst1.1 mRNA levels. sst1.1 FISH and signal intensity determination from confocal images of juvenile fish (42 dpf) that had been subjected to three repetitive ICV injections of ?MSH, SHU9119, or saline over the course of 48 hr. (I) Epistasis between Pomca/?MSH and Sst systems; gh1 expression levels assessed by qRT-PCR analysis after treatment of larvae (14 dpf) for 8 hr with 10 ?M ?MSH, 1 ?M cSST, or a combination of both peptides. Scale bars represent 50 ?m (A?B??) and 10 ?m (C?D??). ?p < 0.05; ??p < 0.01; ???p < 0.001. Error bars in (F)?(I) show SD. |
|
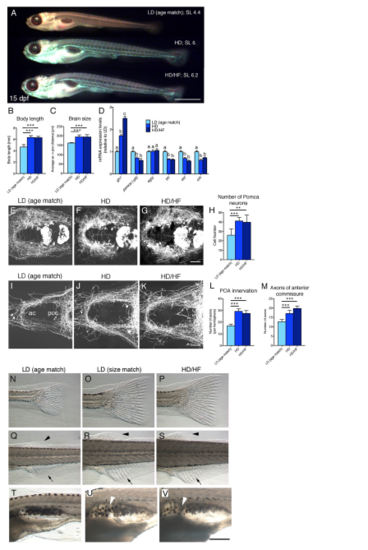
Strong impact of caloric input on somatic growth, neuronal circuit formation and developmental pace of zebrafish larvae ? comparisons between age-matched larvae. Related to Figures 1 and 2. Effects of caloric input on zebrafish larvae raised under LD, HD, or HD/HF feeding conditions from 5 -15 dpf. Analyses were performed at 15 dpf for all groups (age matched). (A) Lateral overview of larvae at 15 dpf stained with Nile red revealing strong differences in body length between LD (age match; standard body length (SL) = 4.4 mm) and HD (standard body length = 6.0 mm), HD/HF larvae (standard body length = 6.2 mm), respectively. Also note differences in fluorescent color profiles of Nile red likely reflecting differences in body fat composition. (B) Quantifications of body length (n=50) and (C) distance between anterior and postoptic commissures as a measure for brain size in pomca:EGFPras transgenic fish (n=5). (D) qRT-PCR analyses: mRNA levels for gh1, pomca (only neuronal fraction), agrp, trh, oxt and crh. Columns with different superscript letters (a,b,c) are significantly different from each other (p<0.05) according to ANOVA followed by a post hoc Tukey test. (E-M) Reduced number of Pomca hypothalamic neurons (E-H) and reduced innervation of preoptic area (POA) and anterior commissure (ac) in LD (age match) larvae compared to HD and HD/HF larvae assessed by anti-GFP IF on pomca:EGFPras transgenics (E-G; I-K) and subsequent quantifications of cell (H; n = 10) and axon numbers (L-M; n = 10). (N-V) Evaluation of developmental progress using anatomical criteria according to Parichy et al. (2009) revealing slower postembryonic development of LD (age match) larvae compared to HD and HD/HF larvae. (N-S) Development of caudal (N-P), dorsal (arrowhead in Q-S) and anal fins (arrow in Q-S) showing differences between LD (age match) versus HD and HD/HF larvae. (T-V) Budding of the anterior lobe of the swimbladder (arrowheads in T-V) has already taken place in HD and HD/HF but not in LD (age match) larvae. Scale bars: (A) 1 mm; (G) 50 ?m for (E-G); (K) 50 ?m for (I-K); (V) 250 ?m for (N-V). p-values: (B, C, H, L, M) ** p < 0.05; *** p < 0.01 relative to LD (age match). Error bars in (B, C, D, H, L, M) show SD. (A, N-V) lateral views; (E-G; I-K) ventral views. |
|
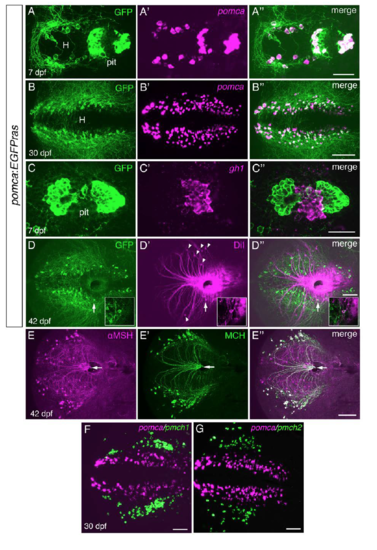
pomca:EGFPras transgenic zebrafish recapitulate endogenous pomca expression and reveal absence of adenohypophyseal innervation. Related to Figure 3. (A-D??) pomca:EGFPras transgenic line. (A-B??) Fluorescent in situ hybridization (FISH) for pomca (magenta) followed by anti-GFP immunofluorescence (IF; green). All Pomca cells in hypothalamus (H) and pituitary (pit) are GFP+ at 7dpf. (B-B??) Colocalization of pomca transcripts and GFP in the hypothalamus at 30 dpf. (C-C??) FISH for gh1 (magenta) and GFP IF (green) at 7 dpf revealing absence of Pomca cell-derived axons in regions of somatotropic cells of the pituitary. (D-D??) DiI injection into the pituitary at 42 dpf labels various hypothalamic neurons lateral to the Pomca cell domain (arrowheads). In three analyzed brains, only one single Pomca neuron (GFP+; arrow) was found to be co-labeled with DiI tracer (see D-D?? insets with magnified views). (E-E??) Co-IF for ?MSH and MCH at 42 dpf reveals cross-reactivity of the anti-?MSH antibody with MCH peptide. All projections towards the pituitary (arrows) are double-positive and thus derived from MCH neurons. (F-G) Double FISH for pmch1 (E, magneta) or pmch2, (F, magneta) and pomca (green) in wild-type brains at 30 dpf. Both pmch1 and pmch2 expressing cells are located lateral to the Pomca cell domain, most likely corresponding to the ?MSH+ but GFP- cell bodies in (E). Scale bars: (A??) 50 ?m, (B??) 100 ?m, (C??) 50 ?m, (D??, E??, F, G) 100 ?m. |
|
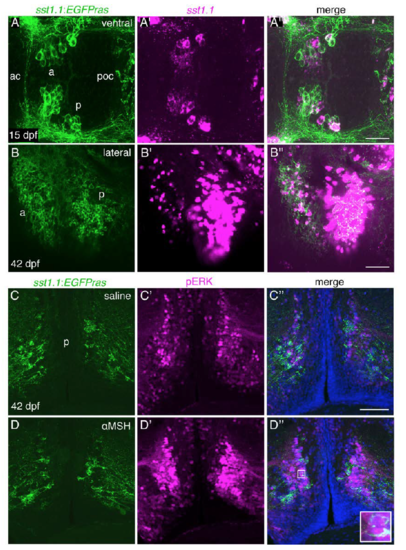
The sst1.1:EGFPras transgenic line recapitulates endogenous sst1.1 expression and reveals activation of hypophysiotropic Sst1.1 neurons after ?MSH ICV injection. Related to Figures 5 and 7. (A-B??) sst1.1 FISH (magenta) in combination with GFP IF (green) in sst1.1:EGFPras transgenic fish at 15 dpf (A-A??) and 42 dpf (B-B??) revealing co-localization of sst1.1 transcripts and GFP both in the anterior (a) and posterior (p) domains of the preoptic area (POA). (C-D??) Co-IF for GFP (green) and pERK (magenta) on cross-sections (12 ?m) at the level of posterior Sst1.1 POA cell clusters of tg(sst1.1:EGFPras) fish (42 dpf), 30 min after cerebroventricular injection of saline (C-C??) or ?MSH/saline (DD??). pERK levels are strongly increased after ?MSH application in a broad region of the POA including Sst1.1 neurons (see arrowheads and inset in D??). Scale bars: (A??): 50 ?m, (B??, C??) 100 ?m. ac: anterior commissure, poc, postoptic commissure. |
|
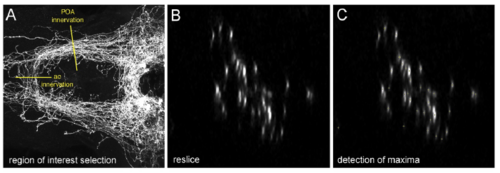
Automated quantification of axon numbers in larval zebrafish brains. Related to Experimental Procedures. (A-C) Anti-GFP IF on a Tg(pomca:EGFPras)fr38Tg larvae at 14 dpf. (A) Confocal image series (z-series) of the preoptic area (POA). Yellow lines depict regions of interest for quantification of axonal innervation of the POA or anterior commissure (ac), respectively. (B) Generation of optical cross sections using the ?Reslice? tool, from Fiji Software (Image J, NIH) allows for visualization of single axons in the respective area. (C) Automated quantification of axons using the ?Find Maxima? function of Fiji Software. Quantified spots are indicated by yellow crosses. |

