
|
Fig. 1
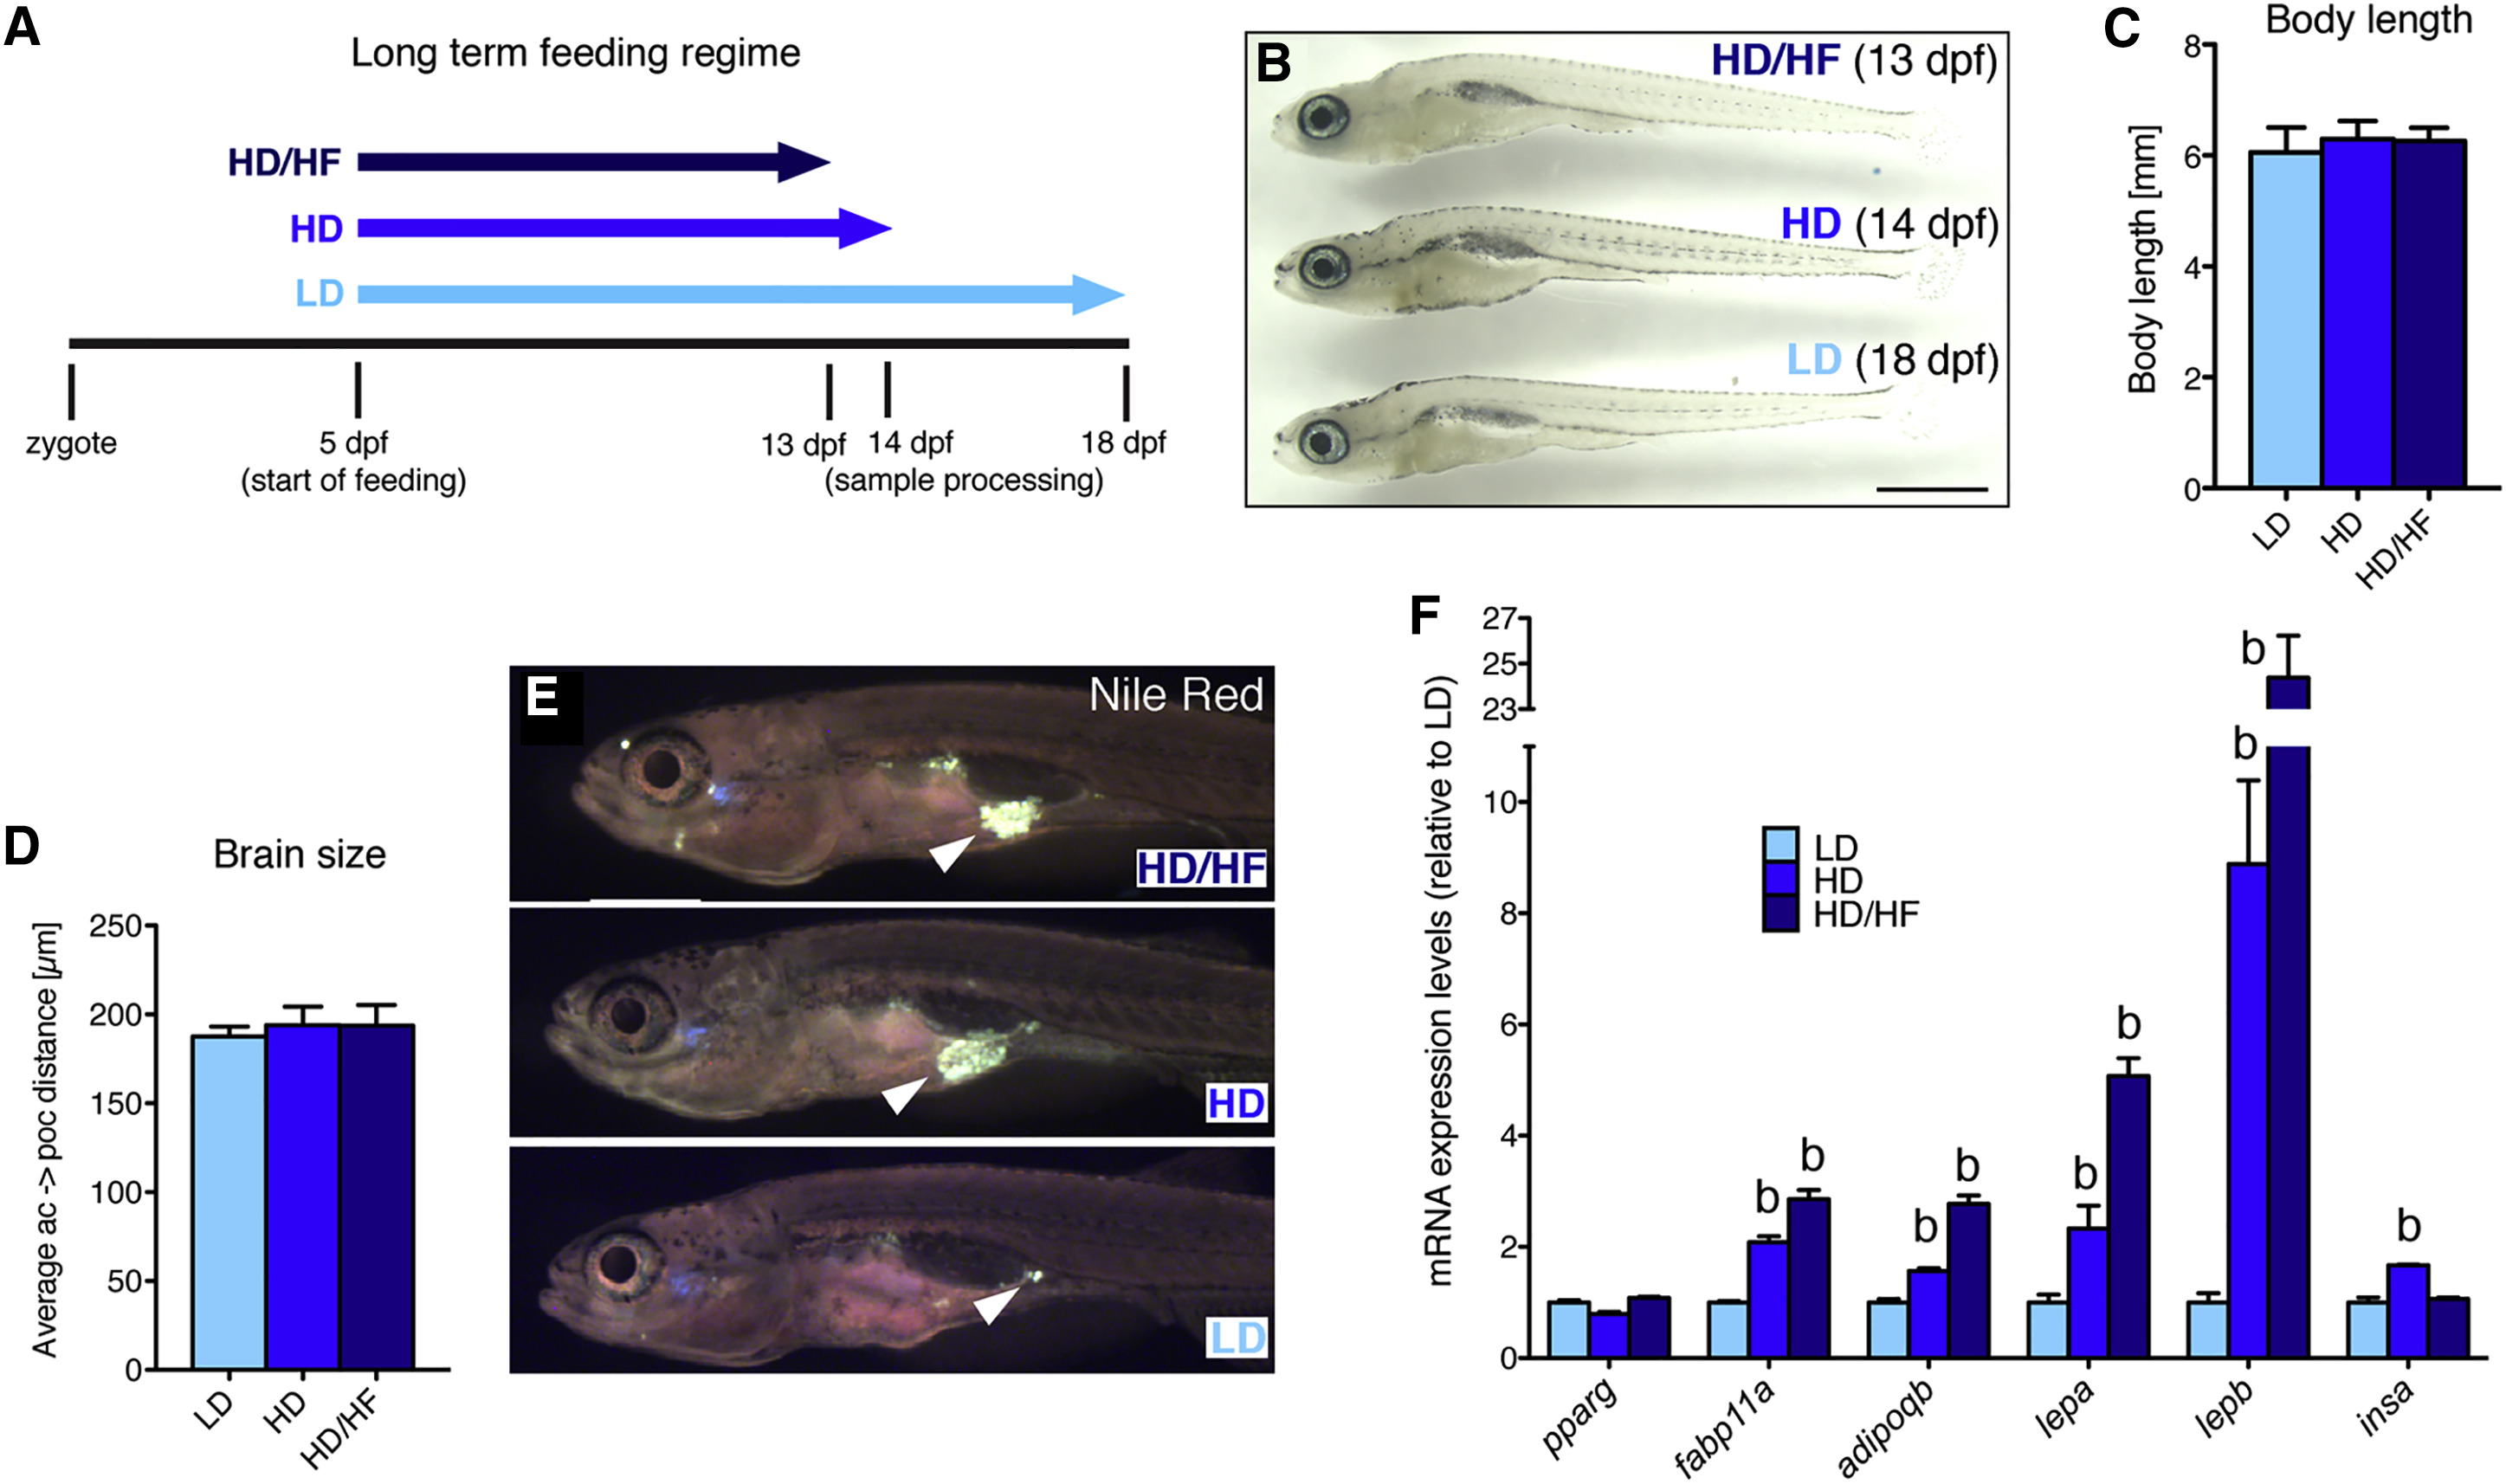
Effects of Long-Term Caloric Excess on Linear Growth and Lipid Metabolism in Larval Zebrafish
(A) Feeding paradigm for generation of size-matched zebrafish larvae with different caloric energy input (see text for details). Samples were collected at a standard body length of 6 mm at 13 dpf (HD/HF), 14 dpf (HD), and 18 dpf (LD).
(B) Lateral view of treated larvae.
(C and D) Quantification of body length (n = 20 for each group) (C) and distance between anterior and postoptic commissures as a measure for brain size (D) in pomca:EGFPras transgenic fish (see Figure 3; n = 10).
(E) Nile red staining of visceral lipids (arrowheads).
(F) qRT-PCR analyses of mRNA levels for pparg, fabp11a, adipoqb, lepa, lepb, and insa.
Scale bar in (B) represents 1 mm. b, p < 0.01 relative to respective LD groups (F). Error bars in (C), (D), and (F) show SD.