
|
Fig. S4
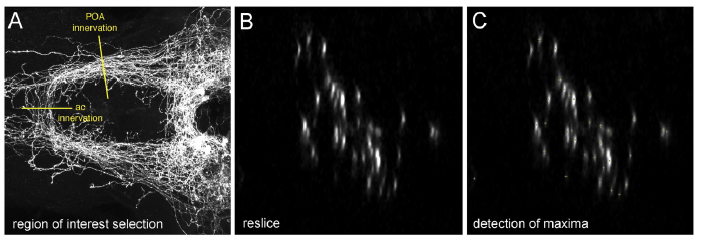
Automated quantification of axon numbers in larval zebrafish brains. Related to Experimental Procedures.
(A-C) Anti-GFP IF on a Tg(pomca:EGFPras)fr38Tg larvae at 14 dpf. (A) Confocal image series (z-series) of the preoptic area (POA). Yellow lines depict regions of interest for quantification of axonal innervation of the POA or anterior commissure (ac), respectively. (B) Generation of optical cross sections using the ?Reslice? tool, from Fiji Software (Image J, NIH) allows for visualization of single axons in the respective area. (C) Automated quantification of axons using the ?Find Maxima? function of Fiji Software. Quantified spots are indicated by yellow crosses.