
|
Fig. 2
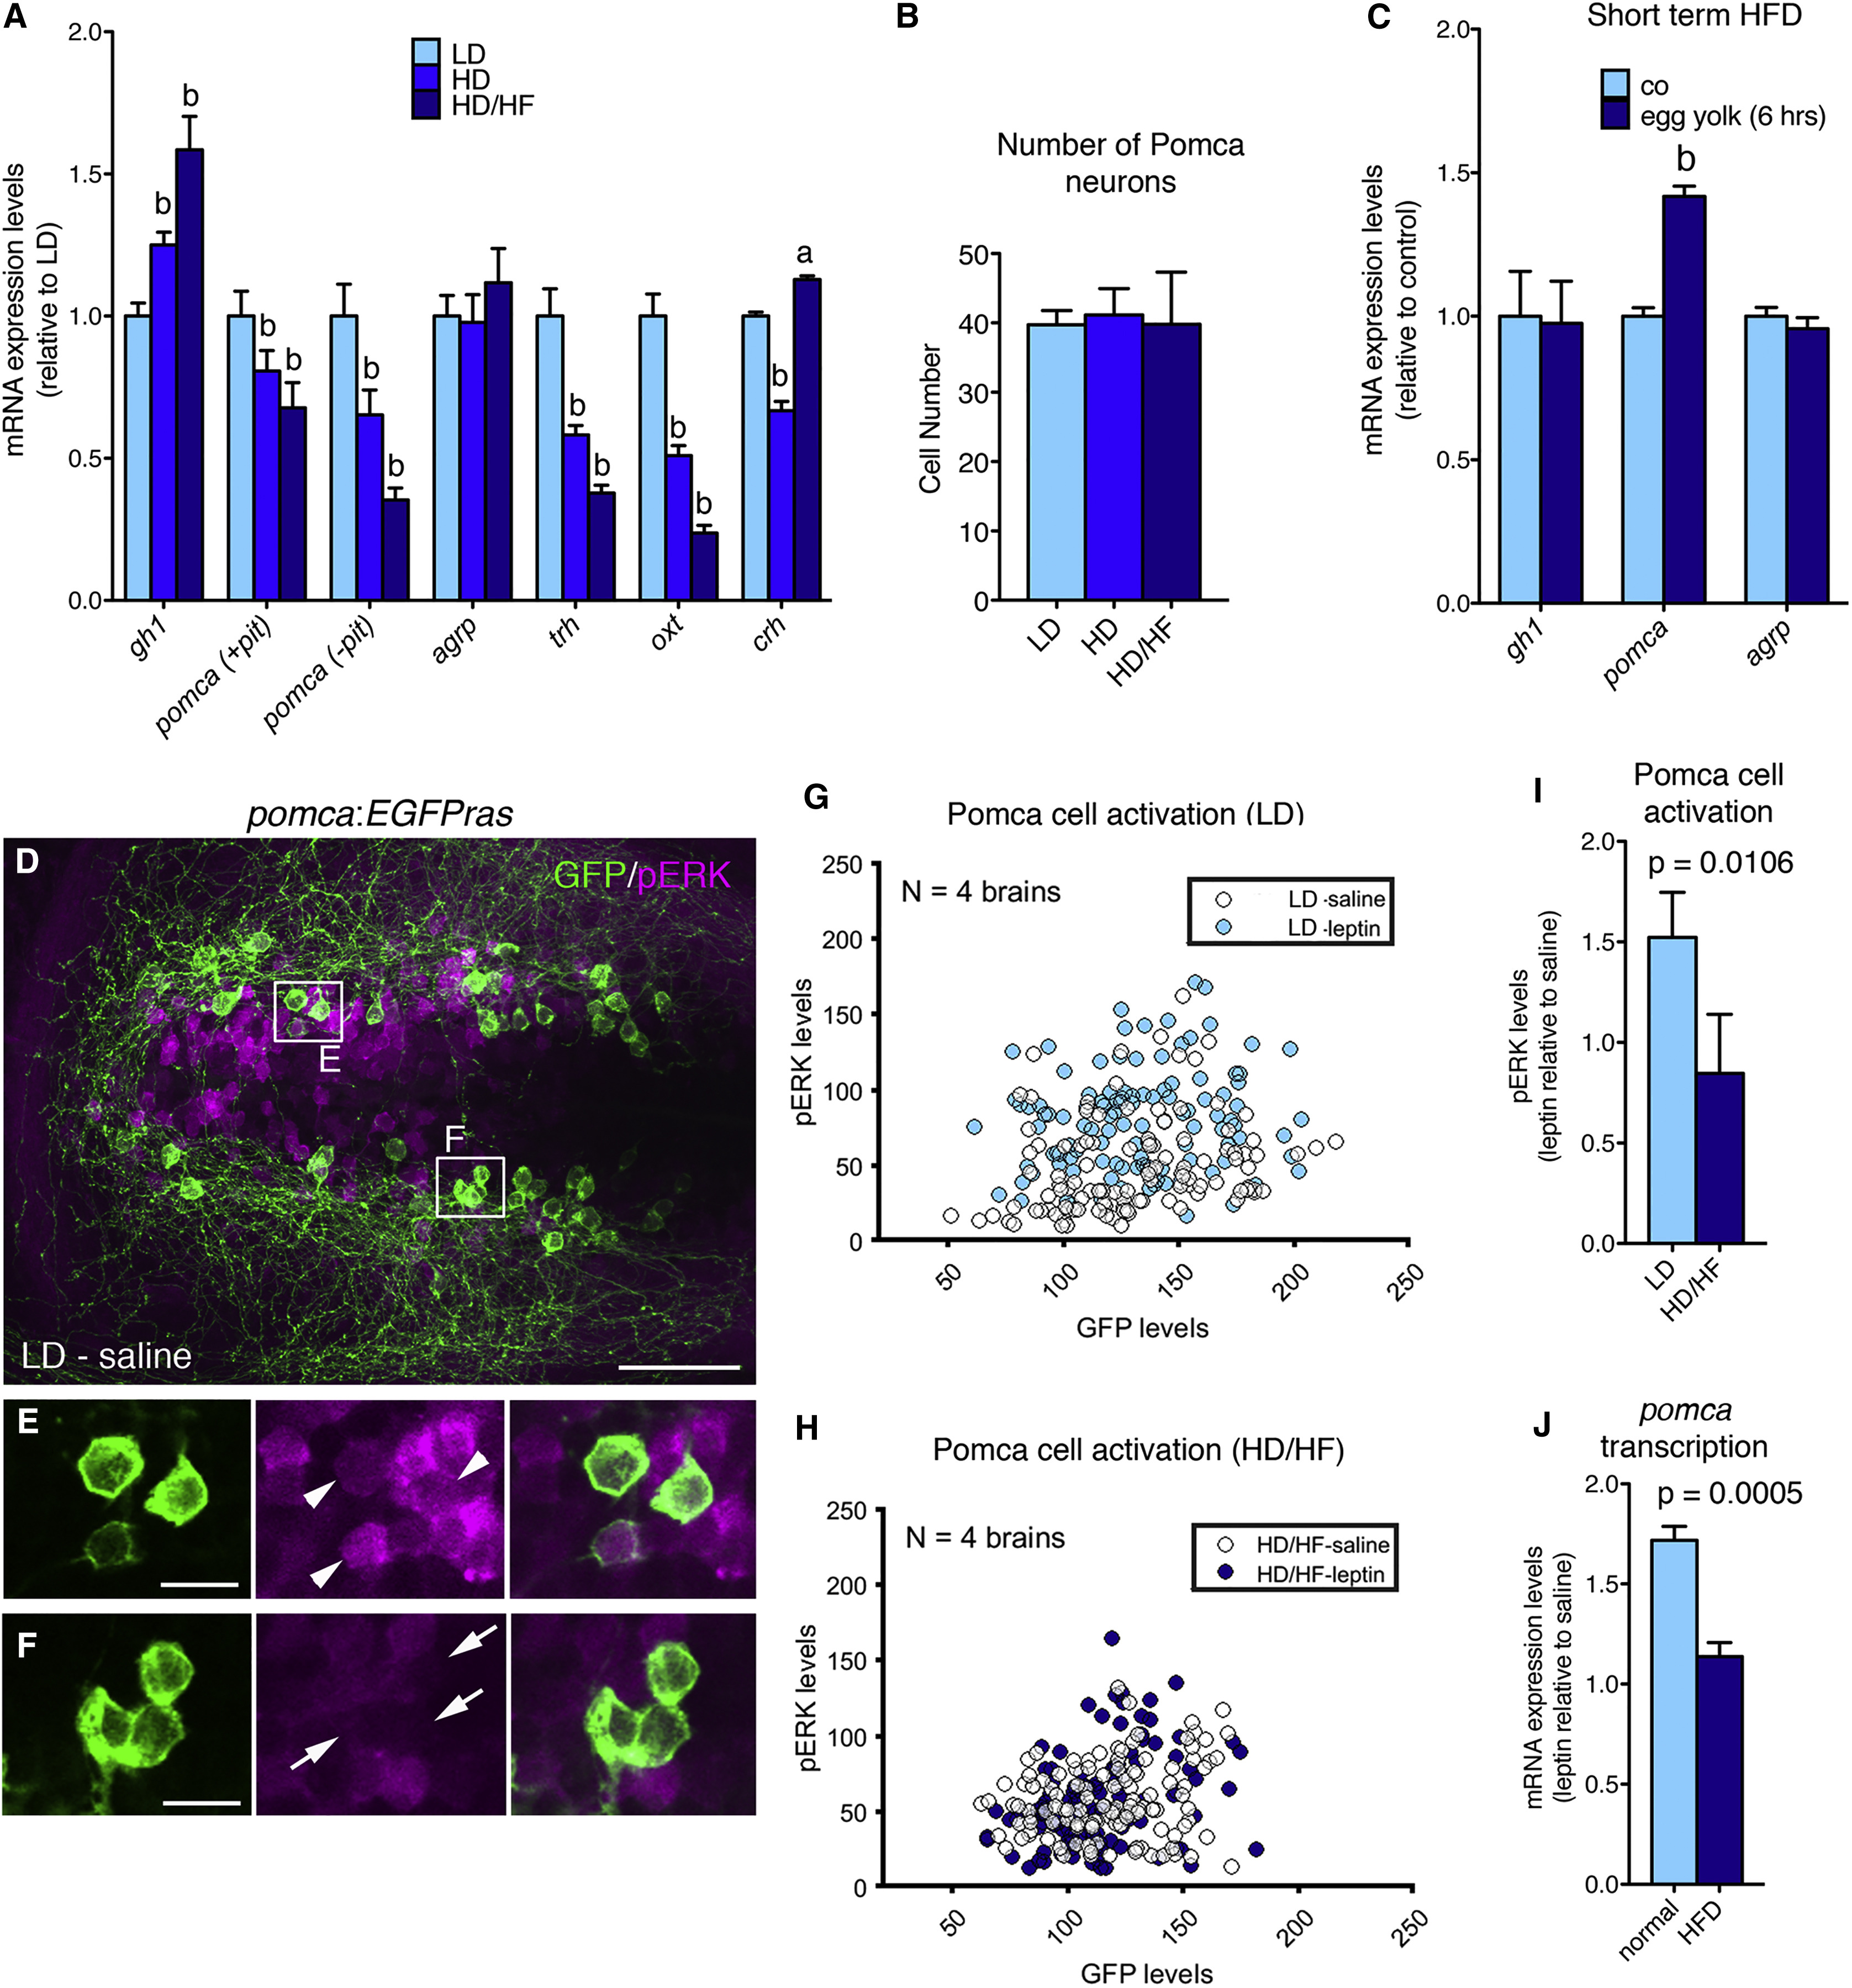
Long-Term Overfeeding Causes Leptin Resistance and Has an Impact on Both the Melanocortin and GH Systems
(A) qRT-PCR analyses of mRNA levels for gh1, pomca, agrp, trh, oxt, and crh. Corticotropin-releasing hormone (Dhillo et al., 2002) (crh) was downregulated in the HD group, but not in the HD/HF group, possibly pointing to stress responses caused by incubation in egg yolk medium. To specifically assess hypothalamic pomca expression levels, the pituitary was removed in pomca (?pit).
(B) Number of Pomca neurons in three feeding groups as determined by anti-GFP IF and cell counts in pomca:EGFPras fish (see Figure 3; n = 10).
(C) mRNA levels of gh1, pomca, and agrp after short-term application of egg yolk to 14 dpf larvae.
(D?F) IF for GFP and pERK on an exemplary pomca:EGPras transgenic larval brain (see Figure 3) subjected to the LD feeding regimen and incubated in saline.
(D) Overview of hypothalamic regions with GFP+/pERK+ domains.
(E and F) Magnification of areas boxed in (D) revealing GFP+/pERK+ cells (E, arrowheads) and GFP+/pERK- cells (F, arrows).
(G?I) pERK and GFP levels in Pomca neurons of size-matched LD (G) and HD/HF (H) pomca:EGFPras larvae treated for 30 min with saline or leptin (n = 4 for each condition), and quantification of normalized values (I).
(J) Relative pomca mRNA levels in juveniles subjected to normal feeding (n = 8) or high-fat diet (HFD; n = 7) for 10 days, 4 hr after ICV injection of recombinant leptin, determined via qRT-PCR normalized against saline-injected controls.
Scale bars represent 50 ?m (D) and 10 ?m (E and F). a, p < 0.05; b, p < 0.01 relative to respective LD groups (A and C). Error bars in (A)?(C), (I), and (J) show SD.