- Title
-
Developmental Vitamin D Availability Impacts Hematopoietic Stem Cell Production
- Authors
- Cortes, M., Chen, M.J., Stachura, D.L., Liu, S.Y., Kwan, W., Wright, F., Vo, L.T., Theodore, L.N., Esain, V., Frost, I.M., Schlaeger, T.M., Goessling, W., Daley, G.Q., North, T.E.
- Source
- Full text @ Cell Rep.
|
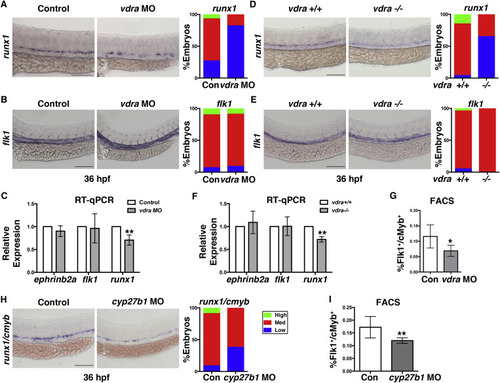
VDR Is Necessary for Zebrafish Definitive Hematopoiesis (A) Representative runx1 WISH images and qualitative phenotype distribution (high/medium/low, n ? 30 embryos/condition) of vdra MO-injected embryos and sibling controls at 36 hpf. Error bars, mean ± SD. (B) WISH example and phenotype distribution for flk1 in vdra morphants (n ? 20 embryos/condition). (C) qPCR analysis quantifying the impact on HSPCs (runx1, ??p < 0.01) and hemogenic endothelium (flk1, ephrinb2a, p = N.S.) in control and vdra morphants (30 embryos/sample × 3 replicates). (D-F) Representative WISH (D), phenotype distributions (E), and qPCR quantification (F) of vdra mutant embryos (runx1, ??p < 0.01; flk1, ephrinb2a, p = N.S.) phenocopied the impact on HSPCs but not on vessels. (G) FACS analysis of vdra morphants indicated significant reductions in Flk1:dsRed+/cMyb:GFP+ HSPCs (?p < 0.05) at 48 hpf (5 embryos/sample × 4 replicates/condition). Error bars, mean ± SD. (H) WISH samples and phenotype distribution of runx1/cmyb expression in cyp27b1 MO-injected embryos at 36 hpf (n ? 30 embryos/condition). (I) FACS analysis showed a significant decrease in HSPCs (??p < 0.01) with cyp27b1 MO injection (n value and error bars as in C). Scale bars, 100 ?m. See also Figure S1. |
|
1,25(OH)D3 Regulates HSPC Numbers via Vitamin D Receptor Signaling (A) Representative runx1/cmyb WISH images and qualitative phenotype distribution following 25(OH)D3 exposure from 12?36 hpf (n ? 40 embryos/condition). (B) FACS analysis of 25(OH)D3-treated (10 ?M) embryos showed a significant increase in HSPCs (??p < 0.01) (5 embryos/sample × 4 replicates/condition). Error bars, mean ± SD. (C) qPCR analysis indicated a significant induction in the VDR transcriptional target cyp24a1 at 36 hpf after exposure to 25(OH)D3 (?p < 0.05) or 1,25(OH)D3 (???p < 0.001) (12?36 hpf) (30 pooled embryos/condition × 3 replicates). (D) Phenotype distribution of runx1/cmyb expression in embryos exposed to increasing concentrations of 1,25(OH)D3 from 12?36 hpf (n ? 30 embryos/condition). (E) FACS analysis of 1,25(OH)D3-treated (10 ?M) embryos showed a 20% increase in HSPCs at 48 hpf (??p < 0.01) compared with controls (n value and error bars as in B). (F) runx1/cmyb WISH and phenotype distribution after exposure to the non-calcemic vitamin D3 analog calcipotriol (n ? 30 embryos/condition). (G) FACS analysis of calcipotriol-treated embryos showed a significantly more HSPCs (?p < 0.05) at 36 hpf (n value and error bars as in B). Scale bars, 100 ?m. See also Figure S2. |

ZFIN is incorporating published figure images and captions as part of an ongoing project. Figures from some publications have not yet been curated, or are not available for display because of copyright restrictions. PHENOTYPE:
|
|
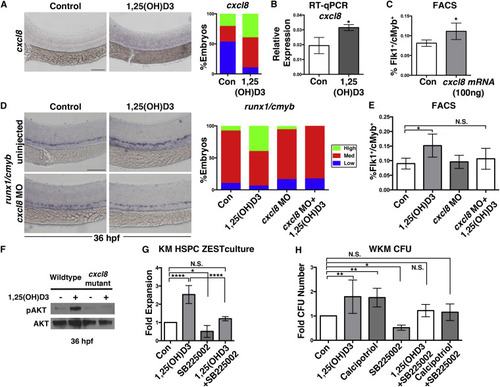
1,25(OH)D3 Mediates HSPC Expansion through CXCL8 Signaling (A) WISH for cxcl8 showing elevated expression with 1,25(OH)D3 treatment at 36 hpf (n ? 30 embryos/condition). (B) Whole-embryo qPCR confirmed increased cxcl8 expression at 36 hpf after 1,25(OH)D3 exposure (?p < 0.05) (40 pooled embryos/condition × 3 replicates). Error bars, mean ± SD. (C) FACS analysis of embryos injected with cxcl8 mRNA (100 ng/embryo) showed increased Flk1:dsRed+/cMyb:GFP+ HSPCs at 36 hpf (?p < 0.05) (5 embryos/sample × 4 replicates/condition). Error bars, mean ± SD. (D) WISH analysis and phenotype distribution indicated that the effect of 1,25(OH)D3 on runx1/cmyb expression was diminished in cxcl8 morphants (n ? 35 embryos/condition). (E) FACS analysis of MO-injected embryos treated with 1,25(OH)D3 (con versus 1,25(OH)D3, ?p < 0.05; con versus cxcl8 MO, N.S.; cxcl8 MO versus cxcl8 MO + 1,25(OH)D3, N.S.; 1,25(OH)D3 versus 1,25(OH)D3 + cxcl8 MO, N.S.)(5 embryos/sample × 4 replicates/condition; error bars, mean ± SD) showed that loss of cxcl8 blocked vitamin D-mediated HSPC expansion. (F) Western blot analysis for pAKT, with AKT as loading control, following 1,25(OH)D3 stimulation (12-36 hpf) in cxcl8 mutants versus WT siblings (60 embryos/condition). (G) WKM stromal cell assay documenting changes in proliferation by 1,25(OH)D3 with and without co-incubation with SB25002 (con versus 1,25(OH)D3, ????p < 0.0001; con versus SB225002, p < 0.05; con versus 1,25(OH)D3 + SB25002, N.S.; 1,25(OH)D3 versus 1,25(OH)D3 + SB25502, ????p < 0.0001) (n = 4; error bars, mean ± SD). (H) WKM methylcellulose CFU assay showing fold increase with and without co-treatment of 1,25(OH)D3 with SB25002 (con versus 1,25(OH)D3, ??p < 0.01; con versus calcipotriol, ??p < 0.01; con versus SB225002, ?p < 0.05; con versus 1,25(OH)D3 + SB25502, N.S.; con versus calcipotriol + SB25502, N.S.). n = 4 (SB25503 is n = 6); error bars, mean ± SD. Scale bars, 100 ?m. See also Figure S5. |
|
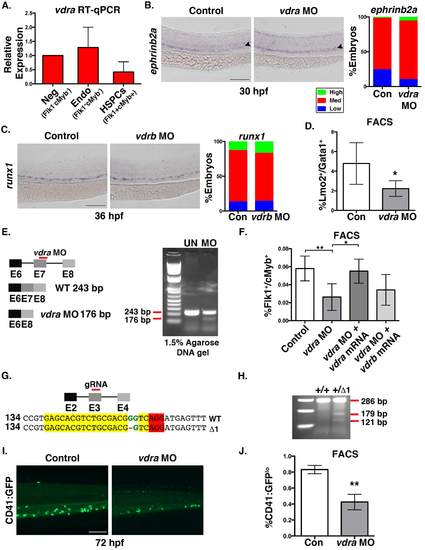
Vdra knockdown affects HSPCs expansion (related to figure 1). A. qPCR for vdra in FACS-sorted Flk1-/cMyb- (double negative), Flk1+/cMyb- (endothelium), and Flk1+/cMyb+ (HSPCs) fractions (cells sorted from ?1000 embryos/condition x 3 replicates) populations at 36hpf. B. Representative ephrinb2a WISH images and qualitative phenotype distribution (High (green)/ Med (red)/ Low (blue); n?40 embryos/condition) of vdra morpholino (MO) injected embryos and sibling controls at 36hpf. C. WISH and phenotype distribution of vdrb MO injected embryos showing no effect on runx1 expression at 36hpf (n?35 embryos/condition). D. FACS analysis of vdra morphants showed a significant decrease in Lmo2:GFP+/Gata1:dsRed+ EMPs (*p<0.05) at 30hpf (5 embryos/sample x 4 replicates/condition); error bars, mean ± SD. E. Schematic representation of the predicted exon 7 truncation caused by the vdra splice MO, and DNA gel analysis showing the smaller vdra band following MO injection (n>20 embryos/condition). F. FACS analysis of HSPCs at 36hpf for vdra morphants (**p<0.01), with and without co-injection of either vdra or vdrb mRNA; vdra mRNA co-injection rescued the reduced number of HSPCs observed with vdra MO alone (vdra MO vs vdra MO + vdra mRNA, **p<0.01; vdra MO vs vdra MO + vdrb mRNA, N.S.) (5 embryos/sample x 4 replicates/condition); error bars, mean ± SD. G. Schematic representation on the CRISPR/cas9-mediated deletion in vdra. H. Gel electrophoresis depicting a mismatched mutation assayed by Surveyor nuclease in vdra heterozygote mutants compared to WT sibling controls. I. Representative fluorescent microscopy example of CD41:GFP expression in the CHT at 72hpf in control and vdra morphants. J. FACS analysis of vdra morphants showed a significant decrease (**p<0.01) in the percentage of CD41:GFPlo;Gata1:dsRed- HSCs (5 embryos/sample x 3 replicates/ condition); error bars, mean ± SD). Scale bar 100?m. |
|
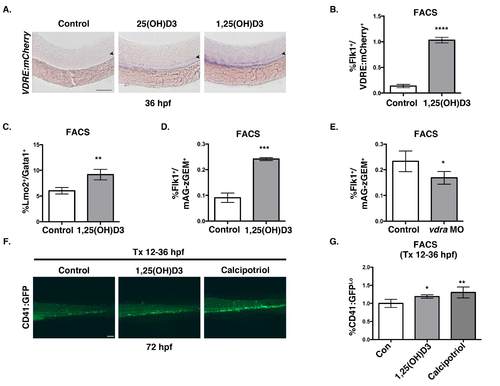
Vitamin D treatment expands HSPC number (related to Figure 2). A. Representative VDRE:mCherry WISH phenotype of embryos treated with 25(OH)D3 and 1,25(OH)D3 compared to DMSO-treated controls (n>10). B. FACS analysis of Tg(flk1:GFP/VDRE:mCherry) embryos treated with 1,25(OH)D3 from 12-36hpf showed a significant (****p<0.0001) increase in Flk1+ cells responsive to 1,25(OH)D3 (5 embryos/sample x 4 replicates/condition); error bars, mean± SD). C. FACS analysis of embryos treated with 1,25(OH)D3 (10?M) indicated a 25% increase in EMPs at 30hpf (**p<0.01) compared to controls (n value and error bars as in S2B). D. FACS analysis of 1,25(OH)D3-treated Tg(flk1:dsred; EF1:mAG-zGEM(1/100) embryos at 36hpf showed a 2-fold increase (***p<0.001) in proliferating endothelial cells, inclusive of the hemogenic population (5 embryos/sample x 4 replicates/condition); error bars, mean ± SD. E. FACS analysis of vdra MO-injected Tg(flk1:dsred; EF1:mAG-zGEM(1/100) embryos at 36hpf indicated a significant decrease in proliferation (*p<0.05) in the absence of Vitamin D3/VDR signaling (n value and error bars as in S2D). F. Representative fluorescent microscopy images of Tg(CD41:GFP) embryos treated with 1,25(OH)D3 (1?M) or calcipotriol (1?M) between 12-36hpf depicting a sustained increase in CD41:GFP+ expression in the CHT at 72hpf. G. FACS analysis at 72hpf showed a significant increase in the percentage of CD41:GFPlo;Gata1:dsRed- HSPCs after both 1,25(OH)D3 (*p<0.05) and calcipotriol (**p<0.01) treatment (5 embryos/sample x 4 replicates/condition); error bars, mean ± SD. Scale bar 100?m. |
|
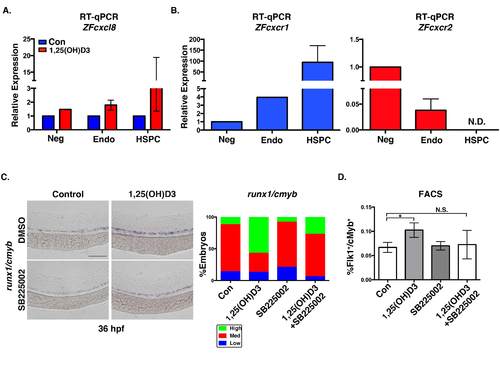
Expression of Cxcl8 receptors cxcr1/cxcr2 in zebrafish HSPCs (related to Figure 5). A. Expression analysis of FACS sorted populations showed enhanced cxcl8 expression following exposure to 1,25(OH)D3, with the biggest effect in Flk1+/cMyb+ HSPCs (cells sorted from ?1000 embryos/condition x 2 replicates); error bars, mean ± SD. B. qPCR analysis of ZFcxcr1 and Zfcxcr2 expression shows enrichment of ZFcxcr1 in FACS sorted HSPCs (Flk1+/cMyb+) and the Flk-/cMyb- population (n=2 replicates, cells sorted from ?1000 embryos/condition); N.D. (not detected). C. WISH analysis and phenotype distributions of embryos treated with 1,25(OH)D3 with and without the CXCL8 inhibitor SB25002 (1?M) showed co-treatment attenuated Vitamin D-mediated increases in runx1/cmyb expression (n?50 embryos/condition). D. FACS quantification of Flk1+/cMyb+ HSPCs after exposure to 1,25(OH)D3 with and without SB25002 (Con vs 1,25(OH)D3, *p<0.01; 1,25(OH)D3 vs SB25002, *p<0.01; Con vs 1,25(OH)D3 + SB25002, N.S.; (5 embryos/sample x 4 replicates/condition; error bars, mean ± SD ). Scale bar 100?m. |

Unillustrated author statements PHENOTYPE:
|

