
Fig. 5
- ID
- ZDB-FIG-161111-6
- Publication
- Cortes et al., 2016 - Developmental Vitamin D Availability Impacts Hematopoietic Stem Cell Production
- Other Figures
- All Figure Page
- Back to All Figure Page
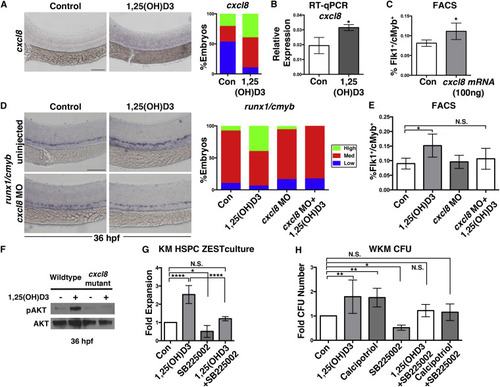
1,25(OH)D3 Mediates HSPC Expansion through CXCL8 Signaling (A) WISH for cxcl8 showing elevated expression with 1,25(OH)D3 treatment at 36 hpf (n ? 30 embryos/condition). (B) Whole-embryo qPCR confirmed increased cxcl8 expression at 36 hpf after 1,25(OH)D3 exposure (?p < 0.05) (40 pooled embryos/condition � 3 replicates). Error bars, mean � SD. (C) FACS analysis of embryos injected with cxcl8 mRNA (100 ng/embryo) showed increased Flk1:dsRed+/cMyb:GFP+ HSPCs at 36 hpf (?p < 0.05) (5 embryos/sample � 4 replicates/condition). Error bars, mean � SD. (D) WISH analysis and phenotype distribution indicated that the effect of 1,25(OH)D3 on runx1/cmyb expression was diminished in cxcl8 morphants (n ? 35 embryos/condition). (E) FACS analysis of MO-injected embryos treated with 1,25(OH)D3 (con versus 1,25(OH)D3, ?p < 0.05; con versus cxcl8 MO, N.S.; cxcl8 MO versus cxcl8 MO + 1,25(OH)D3, N.S.; 1,25(OH)D3 versus 1,25(OH)D3 + cxcl8 MO, N.S.)(5 embryos/sample � 4 replicates/condition; error bars, mean � SD) showed that loss of cxcl8 blocked vitamin D-mediated HSPC expansion. (F) Western blot analysis for pAKT, with AKT as loading control, following 1,25(OH)D3 stimulation (12-36 hpf) in cxcl8 mutants versus WT siblings (60 embryos/condition). (G) WKM stromal cell assay documenting changes in proliferation by 1,25(OH)D3 with and without co-incubation with SB25002 (con versus 1,25(OH)D3, ????p < 0.0001; con versus SB225002, p < 0.05; con versus 1,25(OH)D3 + SB25002, N.S.; 1,25(OH)D3 versus 1,25(OH)D3 + SB25502, ????p < 0.0001) (n = 4; error bars, mean � SD). (H) WKM methylcellulose CFU assay showing fold increase with and without co-treatment of 1,25(OH)D3 with SB25002 (con versus 1,25(OH)D3, ??p < 0.01; con versus calcipotriol, ??p < 0.01; con versus SB225002, ?p < 0.05; con versus 1,25(OH)D3 + SB25502, N.S.; con versus calcipotriol + SB25502, N.S.). n = 4 (SB25503 is n = 6); error bars, mean � SD. Scale bars, 100 ?m. See also Figure S5. |
| Gene: | |
|---|---|
| Fish: | |
| Condition: | |
| Anatomical Terms: | |
| Stage: | Prim-25 |
| Fish: | |
|---|---|
| Condition: | |
| Knockdown Reagent: | |
| Observed In: | |
| Stage: | Prim-25 |