
Fig. S1
- ID
- ZDB-FIG-161111-7
- Publication
- Cortes et al., 2016 - Developmental Vitamin D Availability Impacts Hematopoietic Stem Cell Production
- Other Figures
- All Figure Page
- Back to All Figure Page
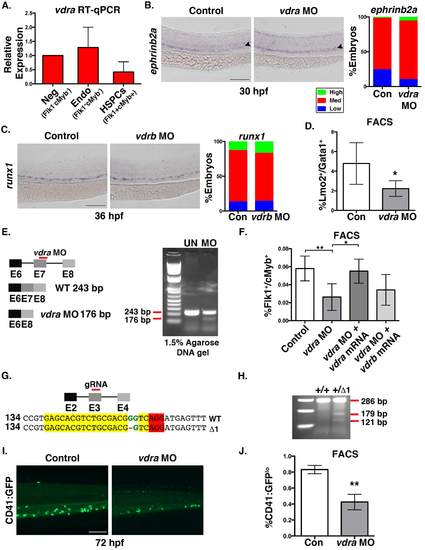
Vdra knockdown affects HSPCs expansion (related to figure 1). A. qPCR for vdra in FACS-sorted Flk1-/cMyb- (double negative), Flk1+/cMyb- (endothelium), and Flk1+/cMyb+ (HSPCs) fractions (cells sorted from ?1000 embryos/condition x 3 replicates) populations at 36hpf. B. Representative ephrinb2a WISH images and qualitative phenotype distribution (High (green)/ Med (red)/ Low (blue); n?40 embryos/condition) of vdra morpholino (MO) injected embryos and sibling controls at 36hpf. C. WISH and phenotype distribution of vdrb MO injected embryos showing no effect on runx1 expression at 36hpf (n?35 embryos/condition). D. FACS analysis of vdra morphants showed a significant decrease in Lmo2:GFP+/Gata1:dsRed+ EMPs (*p<0.05) at 30hpf (5 embryos/sample x 4 replicates/condition); error bars, mean � SD. E. Schematic representation of the predicted exon 7 truncation caused by the vdra splice MO, and DNA gel analysis showing the smaller vdra band following MO injection (n>20 embryos/condition). F. FACS analysis of HSPCs at 36hpf for vdra morphants (**p<0.01), with and without co-injection of either vdra or vdrb mRNA; vdra mRNA co-injection rescued the reduced number of HSPCs observed with vdra MO alone (vdra MO vs vdra MO + vdra mRNA, **p<0.01; vdra MO vs vdra MO + vdrb mRNA, N.S.) (5 embryos/sample x 4 replicates/condition); error bars, mean � SD. G. Schematic representation on the CRISPR/cas9-mediated deletion in vdra. H. Gel electrophoresis depicting a mismatched mutation assayed by Surveyor nuclease in vdra heterozygote mutants compared to WT sibling controls. I. Representative fluorescent microscopy example of CD41:GFP expression in the CHT at 72hpf in control and vdra morphants. J. FACS analysis of vdra morphants showed a significant decrease (**p<0.01) in the percentage of CD41:GFPlo;Gata1:dsRed- HSCs (5 embryos/sample x 3 replicates/ condition); error bars, mean � SD). Scale bar 100?m. |