- Title
-
Single epicardial cell transcriptome sequencing identifies Caveolin-1 as an essential factor in zebrafish heart regeneration
- Authors
- Cao, J., Navis, A., Cox, B.D., Dickson, A.L., Gemberling, M., Karra, R., Bagnat, M., Poss, K.D.
- Source
- Full text @ Development
|
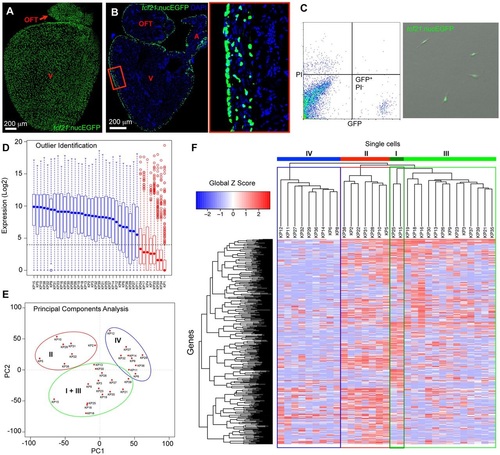
Single-cell transcriptome sequencing of adult zebrafish epicardial cells. (A,B) Whole-mount (A) and section (B) images of an adult tcf21:nucEGFP heart. The boxed region is enlarged to the right. OFT, outflow tract; A, atrium; V, ventricle. Blue, DAPI. (C) FACS isolation of GFP-positive, propidium iodide (PI)-negative, epicardial cells from uninjured hearts of tcf21:nucEGFP adult fish. Drops of isolated cells were plated into a culture dish with DMEM plus 10% FBS for 24h, to examine survival, morphology and GFP signals. (D) Identification of outliers using the Fluidigm SINGuLAR analysis package. Box plot of the expression levels of a set of genes detected in at least half of the samples. Eight samples (red) with median expression (blue or red dot in the box plot) values below the fifteenth percentile (dashed horizontal line) for these genes were removed before further analysis. (E) Principal components analysis (PCA) performed on the 31 cells using the Fluidigm SINGuLAR analysis package. Three main clusters were identified as marked by the ellipses. (F) Hierarchical clustering of the top 500 PCA genes across 31 cells performed in the Fluidigm SINGuLAR package. The three main clusters are labeled in the same color as in E. The green cluster was further divided into two groups with apparent differential gene expression (dark green and light green). Labels I, II, III and IV denote groups. EXPRESSION / LABELING:
|
|
New markers of epicardial cells. In situ hybridization for selected genes on sections from regenerating ventricles at 7 days post injury (dpi) in cmlc2:CreER; bactin2:loxP-mCherry-STOP-loxP-DTA animals treated with tamoxifen, as compared with ventricles from bactin2:loxP-mCherry-STOP-loxP-DTA animals treated with tamoxifen (uninjured). raldh2 served as a 7dpi marker for endocardium and the outermost layer of epicardium. The selected genes show: (A) pan-epicardial expression; (B) exclusive expression in the outermost layer of the ventricle wall; (C) expression within the wall; and (D) expression in the inner part of the wall but absent from the outermost layer. Insets are high-magnification views of the boxed areas. All of the genes were tested on sections from at least four uninjured hearts and five injured hearts. Each heart was represented by at least six sections. When similar patterns were detected in most of the six sections of each heart, and in all of the examined hearts, a conclusion of positive expression was made. |
|
Expression of the cav1:cav1-EGFP reporter. (A) Generation of the cav1:cav1-EGFP BAC reporter. The original 187kb BAC CH211-226K23 covers genes cav2, cav1 and met. The Cav1 translational stop codon (TAA) in exon 3 was replaced with an EGFP-SV40 poly(A) cassette with a 20 amino acid spacer, resulting in a C-terminal fusion protein. (B-E) Visualization of Cav1-EGFP reporter expression in embryos at 3dpf (B,C), 5dpf (D) and 6dpf (E), assessed in the flk1:DsRed2 (B,C,E) or tcf21:DsRed2 (D) background. (B-D) Stereofluorescence scope images; (E) confocal microscopy images. EGFP expression was detected in heart (arrowheads in B,D), blood vessels (B,C,E), notochord (C), branchial arch (D), skin (E), neuromast (E) and other tissues. EXPRESSION / LABELING:
|
|
cav1 displays pan-epicardial expression. (A) Cav1-EGFP reporter expression in a whole-mount adult heart, showing labeling of the entire cardiac surface, including coronary vessels. The boxed region is magnified beneath. (B) Tissue sections indicating that the Cav1-EGFP reporter is expressed in epicardial cells, colocalizing with tcf21:DsRed2 signals. Insets show a higher magnification view of the framed region. (C) Section of outflow tract of cav1:cav1-EGFP reporter fish, stained for the smooth muscle marker Myosin light chain kinase (MLCK) (red), indicating smooth muscle expression of the reporter. The boxed region is magnified beneath. (D,E) Ventricular sections showing Cav1-EGFP reporter expression (green) together with tcf21:DsRed2 or flk1:DsRed2 reporter expression, respectively (red). Nuclei are stained with DAPI (blue). Red/blue/green (RGB) plots along the arrowed lines were generated in ImageJ. Green signals colocalized with red signals in the outermost epicardium, internal cells (likely to be perivascular cells), vascular endothelial cells, innermost EPDCs and endocardium. (F) Upon resection of the ventricular apex, cav1-driven Cav1-EGFP expression (green) is prominent in epicardial cells near the injury site at 1 and 3dpa, and covering the wound at 7dpa. EXPRESSION / LABELING:
|
|
cav1 mutants show normal heart development. (A) Strategy for generating a cav1 mutant using TALENs. The TALEN pair targets the common sequences in exon 2 of isoform a and exon 1 of isoform b. Genotyping primers are indicated by red arrows, spanning intron-exon boundaries. (B) A 10nt deletion mutant, cav1pd1094, was identified. Genotyping results using the PCR primer pair in A, showing a 230bp product in wild type and a 220bp product in homozygous mutants. Samples from heterozygotes showed a higher molecular weight heterodimer product in addition to the two expected bands. (C) Quantitative RT-PCR of cav1 and cav1a in adult hearts of three genotypes, showing slightly reduced RNA levels of cav1a. Fish from three clutches served as three biological replicates, and five hearts per genotype per replicate were used. Meanąs.d., Student′s t-test. (D) Sequence features of Cav1 isoform a. The mutation leads to a truncated protein lacking all the important domains for caveolae formation. (E) Whole-mount adult hearts from the three cav1 genotypes were morphologically indistinguishable. (F) Whole-mount images of tcf21:nucEGFP hearts in the three cav1 genotype backgrounds, showing no differences in epicardial cell density and distribution. (G) Whole-mount images of fli1a:EGFP hearts in the three cav1 genotype backgrounds, showing normal coronary vasculature in mutants. (H) Section images of fli1a:EGFP ventricles in the three cav1 genotype backgrounds, from samples co-stained for troponin T (Tnnt) to indicate cardiac muscle (red) and with DAPI for DNA (blue). Endocardium and muscle sarcomere appeared grossly normal in mutants. Twelve hearts per group were examined for E, and six hearts per group were examined for each of F-H. PHENOTYPE:
|
|
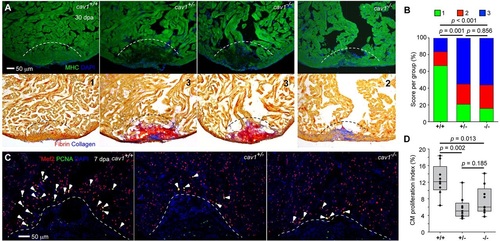
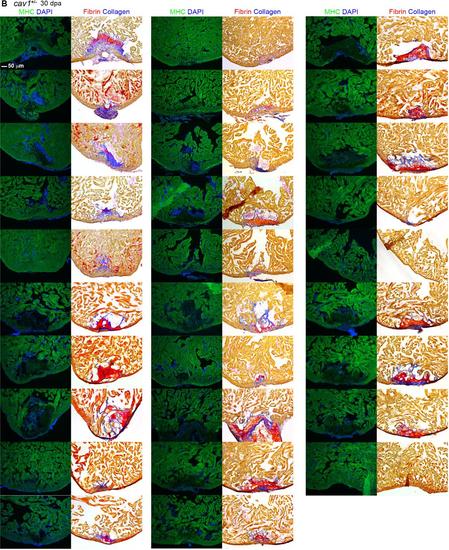
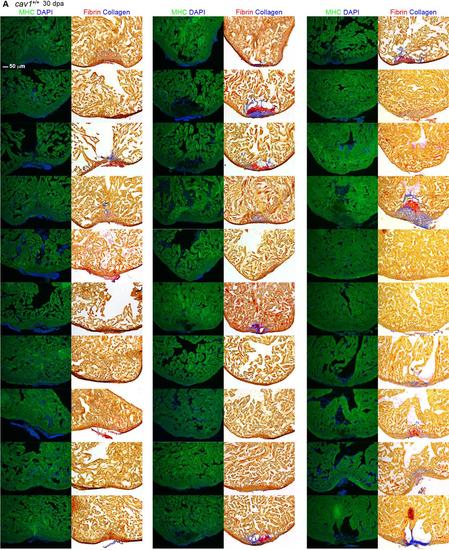
Cav1 is required for zebrafish heart regeneration. (A) cav1 heterozygous and homozygous mutants displayed massive defects in muscle regeneration (top) and fibrin/collagen retention (bottom). Section images of ventricles at 30dpa are stained for Myosin heavy chain (MHC, green) to indicate cardiac muscle. Dashed line indicates plane of resection. The same sections as in the top panels are stained with Acid Fuchsin-Orange G to characterize non-muscle components in the injuries (bottom; blue for collagen, red for fibrin). Twenty-two of 29 ventricles from cav1 heterozygotes and 27 of 32 from cav1 homozygotes showed obvious areas of missing myocardium and prominent scar deposition, compared with 8 of 30 ventricles from wild-type siblings. P<0.001 (Fisher′s exact test) for both heterozygous and homozygous hearts. The numbers 1-3 indicates scores as in B. (B) Quantification of regeneration in cav1 mutants and wild-type siblings at 30dpa. Representative hearts, such as those shown in A, were scored for regeneration: 1, complete regeneration of a new myocardial wall; 2, partial regeneration; 3, a strong block in regeneration. Data indicate the percentage of total hearts represented by each score for each genotype, and were analyzed by Chi-square tests. (C) Section images of injured ventricles from the three cav1 genotypes at 7dpa. Sections are stained for Mef2 (red) and PCNA (green). Arrowheads indicate Mef2+ PCNA+ nuclei. Dashed line indicates plane of resection. (D) Quantification of CM proliferation indices in 7dpa ventricles. For each group, nine fish were assessed, and data were analyzed using Mann?Whitney tests. PHENOTYPE:
|
|
Fibronectin deposition and Tgfβ signaling activation in cav1 mutants. (A) Section images of injured ventricles from the three cav1 genotypes at 7dpa. Sections are stained for Tnnt (red) and fibronectin (Fn, green). (B) Sections of injured ventricles at 14dpa are stained for Tnnt (red) and pSmad3 (green). The boxed regions are enlarged to show details. Arrowheads indicate pSmad3-positive CMs (blue box, Tnnt+) and non-CMs (yellow box, Tnnt -). |
|
Cardiac injury vascularization in cav1 mutants. (A) Sections of injured hearts of fli1a:EGFP fish in three cav1 genotypes at 14dpa, stained for TnnT (red). White dashed lines indicate wound edges, and yellow dashed lines delineate vascularized area from endocardial area. (B) Quantification of EGFP+ vascular endothelial area in wounds with respect to wound edge lengths. Student′s t-test; n=11 for wild type, n=10 for heterozygotes, and n=10 for homozygotes. |
|
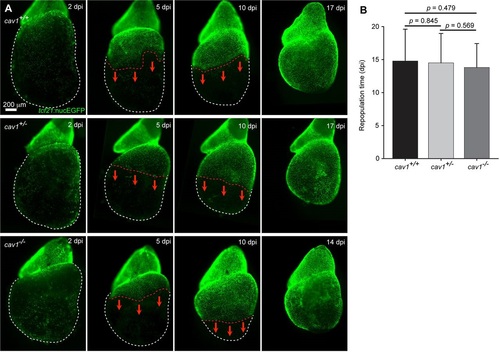
Normal ex vivo epicardial regeneration in cav1 mutants. (A) Adult hearts of tcf21:NTR; tcf21:nucEGFP fish in different cav1 backgrounds were cultured as explants and tested for epicardial cell regeneration after at least 90% genetic ablation. White dashed lines delineate ventricles and red dashed lines delineate the epicardial sheet edge. Red arrows indicate the direction of epicardial regeneration. (B) Quantification of days to repopulate the ventricle after 90% or greater epicardial cell ablation. Meanąs.d., Student′s t-test; n=18 for wild type, n=26 for heterozygotes and n=21 for homozygotes. dpi, days post Mtz incubation. |
|
In situ hybridization for selected genes. In situ hybridization for selected genes was performed on sections of uninjured hearts (ventricles from bactin2:loxP-mCherry- STOP-loxP-DTA animals treated with tamoxifen) and injured hearts (ventricles at 7 dpi in cmlc2:CreER; bactin2:loxP-mCherry-STOP-loxP-DTA animals treated with tamoxifen). |
|
In situ hybridization on embryos. In situ hybridization for selected genes was performed using 3 dpf or 4 dpf embryos. |
|
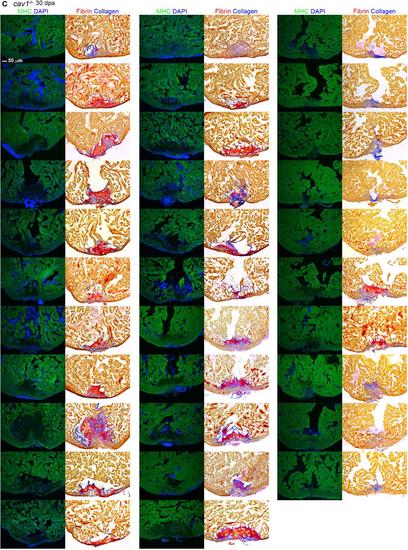
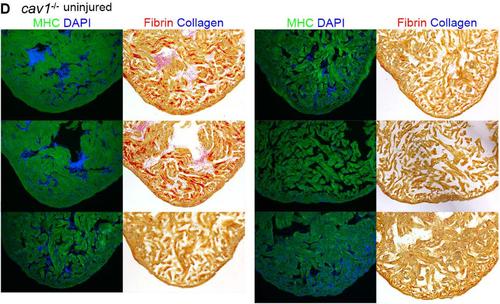
Representative sections from each of 91 hearts of wild-types (A), cav1 heterozygotes (B), and cav1 homozygotes (C), at 30 dpa. Sections from uninjured cav1 homozygous mutant hearts are shown in (D). Ventricular sections are stained for MHC (green) to denote cardiac muscle. The same sections in left panels are stained with acid fuchsin orange G to characterize nonmuscle components in the injuries (right; blue for collagen, red for fibrin). |
|
A second allele of cav1 disrupts heart regeneration. (A) The TALEN pairs were used to target to the sequences labeled in red, which is the common sequence of both isoforms. A mutant with a 23-nt deletion, cav1pd1104, was identified, which leads to truncated proteins of both a and b isoforms lacking all the important domains for caveolae formation. (B) cav1pd1104 heterozygous mutants (right) displayed severe defects in muscle regeneration (top) and fibrin/collagen retention (bottom). Section images of ventricles at 30 dpa are stained for MHC to denote cardiac muscle. Dashed line indicates plane of resection. The same sections in top panels are stained with acid fuchsin orange G to characterize non-muscle components in the injuries (bottom; blue for collagen, red for fibrin). (C) Quantification of regeneration scores between cav1 mutants and wildtype siblings were compared at 30 dpa. Data indicate the percent of total hearts represented by each score for each genotype. n = 9 for wild-types, and n = 16 for heterozygotes. PHENOTYPE:
|

