- Title
-
Serotonin Promotes Development and Regeneration of Spinal Motor Neurons in Zebrafish
- Authors
- Barreiro-Iglesias, A., Mysiak, K.S., Scott, A.L., Reimer, M.M., Yang, Y., Becker, C.G., Becker, T.
- Source
- Full text @ Cell Rep.
|
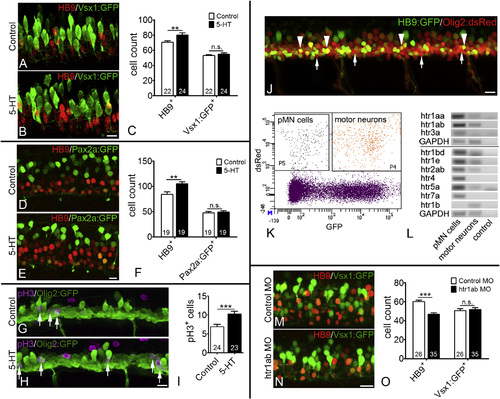
Serotonin Signaling Promotes Embryonic Motor Neuron Generation Lateral views of spinal cords at 33 hpf are shown. (A?F) Serotonin (5-HT) treatment (24?33 hpf) increases the number of HB9 immuno-labeled motor neurons but has no influence on vsx1:GFP (A?C) and pax2a:GFP labeled interneurons (D?F) in the same embryos (Student?s t test in C, p = 0.0077; in F, p = 0.002). (G?I) Serotonin treatment increases the number of dividing (pH3+) olig2:GFP+ pMN progenitor cells (Student?s t test in I; p = 0.0006). (J?L) Lateral view of a double-transgenic olig2:dsRed/HB9:GFP embryo is shown with red only (arrows, pMN progenitors) and double-labeled (arrowheads, motor neurons) cells indicated in the spinal cord (J). A typical FACS profile is shown (K). In RT-PCR, serotonin receptors show enrichment in pMN progenitor cells, compared to motor neurons (L). GAPDH is used for comparison. (M?O) Morpholino knockdown of receptor htr1ab reduces the number of HB9+ motor neurons but does not influence the number of vsx1:GFP+ interneurons in the same embryos (Student?s t test; p < 0.0001). The scale bar in (B) represents 10 Ám for (A) and (B), in (E) represents 10 Ám for (D) and (E), in (H) represents 15 Ám for (G) and (H), and in (N) represents 15 Ám for (M) and (N). See also Figure S1. |
|
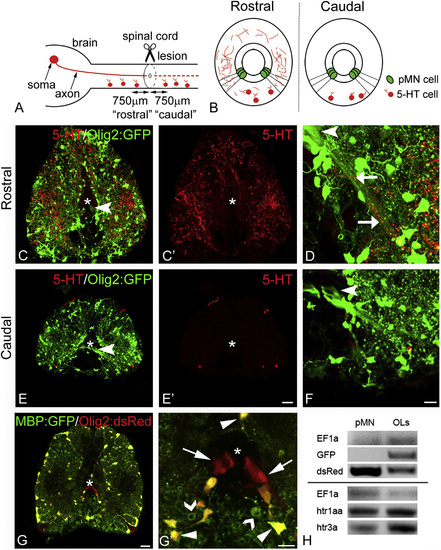
Serotonergic Axons Are Located in Close Proximity to Processes of pMN-like Adult Progenitor Cells Only Rostral to the Lesion Spinal cross-sections are shown (dorsal is up; asterisk indicates central canal). (A and B) Timeline and schematic representations of serotonergic axons in the injured spinal cord in lateral (A) and cross-sectional views (B), indicating the areas of analysis and density of serotonergic axons in relation to pMN-like ERGs. (C?F) Overviews of 5-HT+ labeling in olig2:GFP fish rostral (C and C′) and caudal (E and E′) to the lesion are shown. In the ventro-lateral area, close apposition of serotonergic axons (red) with radial processes (green, arrows) of olig2:GFP+ pMN-like progenitor cells (arrowheads) are visible rostral (D), but not caudal (F), to the lesion. (G and G′) Olig2:dsRed+/mbp:GFP ERGs (arrows), olig2:dsRed+/mbp:GFP+ oligodendrocytes (arrowheads), and myelin sheaths (open arrowheads) are indicated (G, overview; G′, detail). (H) PCR after FACS indicates dsRed-only-labeled cells are enriched in the pMN-like ERG fraction, whereas GFP is only amplified in the oligodendrocyte fraction (OLs). EF1alpha is included for comparison. hrt1aa and hrt3a are expressed in adult pMN-like ERGs. The scale bar in (E′) represents 50 Ám for (C), (C′), (E), and (E′); in (F) represents 25 Ám for (D) and (F); in (G) represents 25 Ám; and in (G′) represents 10 Ám. See also Figure S2. EXPRESSION / LABELING:
|
|
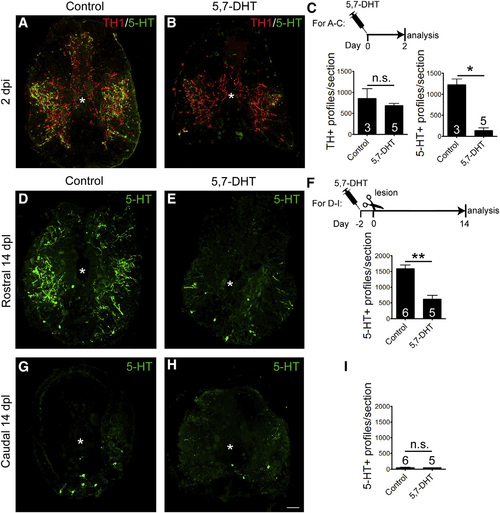
Serotonergic, but Not Dopaminergic, Descending Axons Are Ablated by 5,7-DHT Spinal cross-sections are shown (dorsal is up; asterisk indicates central canal). (A?C) An intraperitoneal injection of 5,7-DHT ablates serotonergic (5-HT), but not TH1+, axons within 2 days (Mann-Whitney U-test; p = 0.0357). (D?I) At 14 dpl, the number of axons rostral to the lesion is still strongly reduced after prior ablation (D?F), whereas caudal to the lesion, the low axon density is unaltered (G?I; Mann-Whitney U-test; p = 0.0022). The scale bar in (H) represents 50 Ám. See also Figure S3. |
|
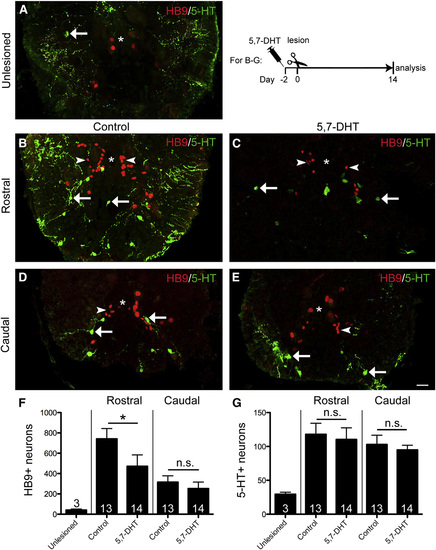
Ablation of Serotonergic Axons Inhibits Regeneration of Motor Neurons, but Not Serotonergic Neurons Spinal cross-sections are shown (dorsal is up; asterisk indicates central canal). (A) In the unlesioned spinal cord, few small HB9+ and motor neurons and 5-HT+ cells (arrow) are present. (B?G) Rostral to the lesion (see timeline for experimental condition), ablation of serotonergic axons leads to reduced motor neuron (arrowheads) regeneration without influencing regeneration of serotonergic neurons (arrows). Caudal to the lesion, numbers of newly generated motor neurons and serotonergic neurons are unaltered (Mann-Whitney U-test; p = 0.0344). The scale bar in (E) represents 25 Ám. See also Figure S4. |
|
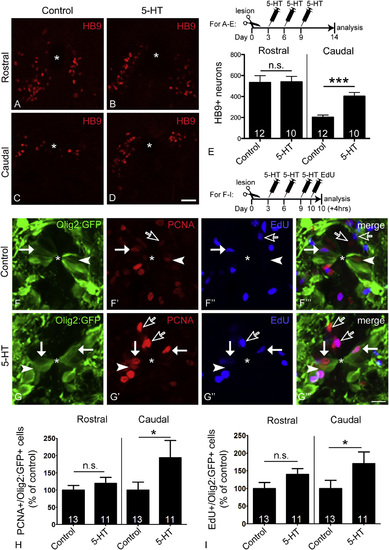
Serotonin Injections Increase the Number of Newly Generated Motor Neurons and Proliferating pMN-like Progenitor Cells Caudal to the Spinal Lesion Cross-sections through the spinal cord are shown; asterisks indicate the central canal, arrowheads indicate PCNA+/olig2:GFP+ cells, solid arrows indicate EdU+/olig2:GFP+ cells, and empty arrows indicate PCNA+/olig2:GFP or EdU+/olig2:GFP cells. (A?E) Serotonin injection doubles the number of newly generated motor neurons caudal to the lesion but has no effect rostral to the lesion (see timeline in E for experimental paradigm; Student?s t test; p < 0.0001). (F?I) In the ventricular zone of olig2:GFP transgenic animals, the numbers of PCNA+/olig2:GFP+ (Mann-Whitney U-test; p = 0.0437) and EdU+/olig2:GFP+ (Mann-Whitney U-test; p = 0.0231) pMN-like ERGs are significantly increased only caudal to the lesion (see timeline for experimental paradigm). The scale bar in (D) represents 50 Ám for (A)?(D) and in (G′′′) represents 10 Ám for (F) and (G). See also Figure S5. |
|
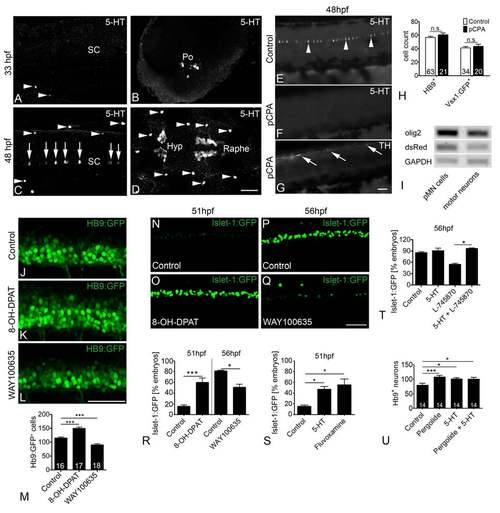
Serotonin (5-HT) promotes motor neuron development. A,C: Lateral views of the trunk region (left column) indicate that spinal-intrinsic serotonergic cells (arrows) are present at 48, but not 33 hpf. (arrowheads indicate serotonergic cells in the periphery). B: A dorsal view of the brain indicates only a few serotonergic cells in the region of the preoptic nucleus (Po) of the diencephalon. D: In contrast, large populations of serotonin-labeled neurons are present in dorsal views in the hypothalamus (Hyp) and raphe region at 48 hpf. E-G: Lateral views of the trunk indicate that treatment with pCPA from 24 hpf effectively inhibits serotonin (5-HT) accumulation in spinal neurons (E,F), but does not influence the presence of tyrosine hydroxylase (TH) expressing descending axons (arrows) in the spinal cord (G). H: pCPA treatment does not affect numbers of motor neurons or vsx1:GFP+ interneurons at 33 hpf. I: Endogenous olig2 mRNA, as well as DsRed mRNA are enriched in FAC sorted progenitor cells, compared to the motor neuron fraction, as shown by RT-PCR in olig2:DsRed and HB9:GFP double transgenic fish. GAPDH is used for comparison. J-M: A 5-HT1A agonist (8OH-DPAT) increases and an antagonist (WAY100645) decreases numbers of hb9:GFP+ motor neurons (ANOVA, P<0.0001). Lateral views of embryos at trunk level are shown; drug incubation form 24 to 33 hpf. N-R: Similarly, 8-OH-DPAT promotes (Student t-test, P=0.0002) and WAY100645 inhibits (Mann-Whitney U-test, one-tailed, P=0.0383) development of islet- 1:GFP+ motor neurons. S: Serotonin re-uptake inhibitor fluvoxamine promotes development of islet-1:GFP+ motor neurons, similar to serotonin (ANOVA with Dunn?s Multiple Comparison Test, p < 0.05). T: Serotonin rescues the effect of blocking Drd4 receptors with L-745870 on development of islet-1:GFP+ motor neurons (Mann-Whitney U-test, one-tailed, p=0.0383), indicating that serotonin does not act through the Drd4a receptor. U: Dopamine agonist pergolide (ANOVA with Bonferroni?s Multiple Comparison Test, p < 0.001) and serotonin (p < 0.05) increase numbers of HB9+ motor neurons, but have no additive effect. Scale bars = 50 Ám. |
|
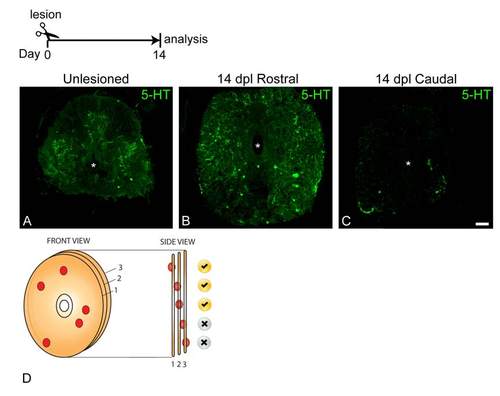
Characterization of serotonergic (5-HT) signal and pMN progenitors. A-C: Distribution of serotonergic axons in the unlesioned and lesioned spinal cord at 14 days post-lesion is shown in cross sections through the spinal cord; asterisks indicate the central canal. D: Schematic representation of cell counts in spinal cord sections. All cells are included in the counts, except for those cells that are visible in the last optical section. Scale bar in C = 50 Ám. |
|
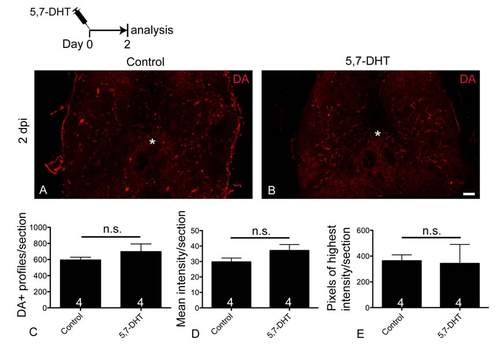
Spinal dopamine abundance is not detectably altered after ablation of serotonergic axons with 5,7-DHT. A,B: Cross sections through the spinal cord are shown; asterisks indicate the central canal. Immunohistochemistry for dopamine reveals dopaminergic axons in the spinal cord of vehicle-injected and 5,7-DHT injected animals at 2 days post-injection. C-E: Number of axonal profiles (Student?s t-test, P = 0.3787), as well as mean (P = 0.1875) and peak (P = 0.4724) intensities of dopamine labeling were not detectably different between control and toxin treated animals. Scale bar in B = 50 Ám. |
|
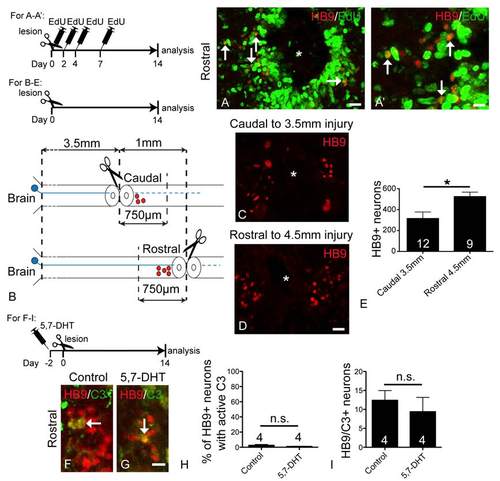
Evidence that HB9 immuno-reactive motor neurons are newly generated after a lesion (A, A′), that descending axons influence generation of motor neurons (B-E) and that serotonin signaling does not affect cell death of regenerated motor neurons (F-I). A,A′: Cross sections through the spinal cord are shown; asterisks indicate the central canal. A′ is a higher magnification of the left middle area in A. Multiple EdU injections (see timeline) lead to double labeling of almost half of the newly present HB9+ neurons (arrows) after a lesion. B-E: Placing lesions 1 mm apart makes it possible to compare neurogenesis in the same intervening stretch of spinal cord with either descending axons present (caudal lesion) or absent (rostral lesion) (B). Labeling (C,D) and counts (E) of new HB9+ motor neurons in these equivalent areas up to 750 Ám away from the lesion site indicated significantly more new HB9+ motor neurons when the lesion was situated caudal to sampled area (Student?s t-test, *P = 0.0184). F-I: Double labeling with HB9 and caspase 3 antibodies in control animals and those in which descending serotonergic axons were ablated, did not show increased proportions (Mann-Whitney U-test, P = 0.3429) or numbers (Mann-Whitney Utest, P = 0.6857) of double-labeled cells (arrows) rostral to the lesion site at 14 days post-lesion. Bar in A = 25 Ám; in A′ = 12.5 Ám; in D = 25 Ám for C,D; in G = 12.5 Ám for F,G. |
|
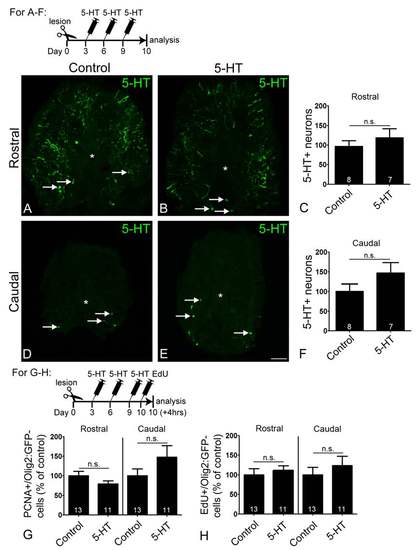
Serotonin (5-HT) injections do not increase numbers of serotonergic neurons or proliferation of ventricular cells outside the pMNlike domain. A-F: Cross sections through the spinal cord are shown; asterisks indicate the central canal; arrows indicate serotonergic neurons. Serotonin injections do not significantly increase numbers of serotonergic neurons rostral (Mann-Whitney U-test, P = 0.5358) or caudal (Mann-Whitney U-test, P = 0.2810) to the lesion site. G,H: In contrast to the cells in the olig2:GFP+ pMN-like domain (compare Fig. 4F-I), the number of PCNA+ (Student?s t-test, Rostral P = 0.1640, Caudal P = 0.1656) or EdU+ (Student?s t-test, Rostral P = 0.5525, Caudal P = 0.4323) ventricular cells outside that domain (open arrows in Fig. 4F,G), were not significantly altered by addition of serotonin. Scale bar in E = 50 Ám. |

