- Title
-
Reptin/Ruvbl2 is a Lrrc6/Seahorse interactor essential for cilia motility
- Authors
- Zhao, L., Yuan, S., Cao, Y., Kallakuri, S., Li, Y., Kishimoto, N., Dibella, L., and Sun, Z.
- Source
- Full text @ Proc. Natl. Acad. Sci. USA
|
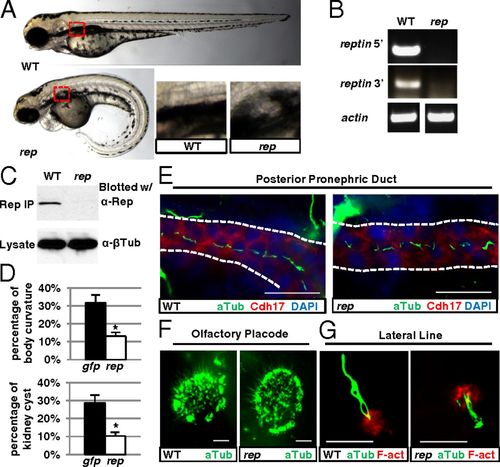
Phenotypes of reptinhi2394 mutants. (A) Reptinhi2394 mutant (rep) at 3 d postfertilization (dpf) showing kidney cyst (red box, magnified in Lower Right) and body curvature, compared with wild-type (WT) fish. (B) RT-PCR using lysates of 2-dpf reptinhi2394 (rep) and WT siblings. Two pairs of primers, one to the 52 side of the proviral insertion and one to the 32 side, were used. (C) The greatly reduced Reptin protein in 4-dpf reptinhi2394 mutant (rep). (Upper) Samples precipitated and blotted with anti-Reptin. (Lower) Lysates blotted with anti?β-tubulin as a loading control. (D) Microinjection of reptin-eGFP mRNA (rep) reduced the percentages of body curvature (Upper) and kidney cysts (Lower) in embryos from reptinhi2394+/ crosses, with eGFP mRNA (gfp) microinjection as a negative control. Data are represented as mean + SD, from three replicates. *P < 0.05. (E?G) Immunostaining showing cilia (in green) in reptinhi2394 mutants (rep) in the posterior pronephric duct (E) (stained with anti-Cdh17, a marker for kidney epithelial cells, in red and lined with dotted lines), the olfactory placode (F), and the lateral line organ (G) [F-actin (F-act) stained with rhodamine phalloidin in red]. (Scale bar, 20 μm in E and F and 10 μm in G.) PHENOTYPE:
|
|
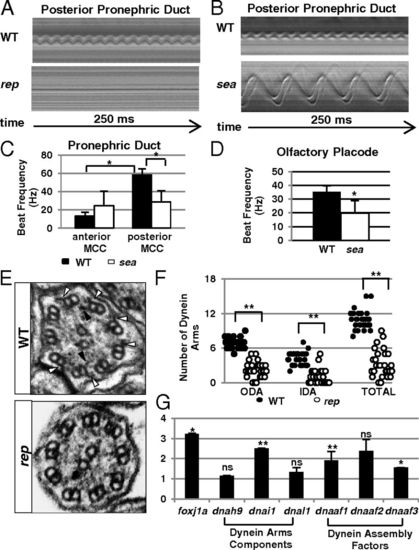
Reptin is essential for cilia motility. (A and B) Kymographs showing the rhythmic beating of a multicilia bundle in the posterior pronephric duct in a wild-type (WT) embryo and paralyzed cilia in a reptinhi2394 mutant (rep), or a slower beating cilium in a seahorsehi3308 mutant (sea) at 3 dpf. (C) Cilia beating frequency in wild-type (black bar) and seahorsehi3308 (white bar) pronephros at 3 dpf. Data are represented as mean + SD, from eight replicates. *P < 0.05. (D) Cilia beating frequency in the olfactory placode of wild-type (black bar, WT) and seahorsehi3308 mutant (white bar, sea) embryos at 3 dpf. Data are represented as mean + SD, from five replicates. *P < 0.05. (E) Electron micrographs of cross-sections of cilia in WT and reptinhi2394 mutants (rep) at 5 dpf. Outer and inner dynein arms are pointed out by white and black arrowheads, respectively. (F) Number of outer and inner dynein arms in WT and reptinhi2394 mutants (rep) per section at 5 dpf. Data are represented as mean + SD. **P < 0.01. (G) Expression levels of multiple factors involved in dynein arm formation as shown by quantitative PCR (qPCR). Y axis shows the fold changes in reptinhi2394 mutants. Data are represented as mean + SD, from three replicates. *P < 0.05, **P < 0.01. NS, nonsignificant. EXPRESSION / LABELING:
PHENOTYPE:
|
|
Reptin binds to and colocalizes with Lrrc6/Seahorse. (A) Anti-Flag IP brings down endogenous Lrrc6/Seahorse in lysates of 2-dpf embryos overexpressing Flag-tagged Reptin (rep), but not in embryos overexpressing Flag-tagged eGFP (gfp). Bottom arrow points to Reptin-Flag (Left) and Gfp-Flag (Right). To avoid interference from the signal of IgG light chain, the blot was cut at the bottom before exposure. (B) The percentage of body curvature (Left) and kidney cyst (Right) in embryos from seahorsehi3308+/- crosses uninjected (uninj), injected with wild-type seahorse mRNA (WT), and mutant seahorse mRNA encoding full-length Seahorse with the amino acids 392?396 alanine substitution (MT). Data are represented as mean + SD, from three replicates, **P < 0.01. (C) Western blot on whole embryo lysate of embryos from seahorsehi3308+/- crosses unjected (uninj), injected with GFP-tagged wild-type seahorse mRNA (WT), or GFP-tagged mutant seahorse mRNA as in B (MT). (D) Immunostaining of the pronephric duct (white line) in 4-dpf wild type (WT) and reptinhi2394 mutants (rep). Cilia are labeled with antiacetylated tubulin (Ace-Tub) in red, and Reptin is labeled with anti-Reptin (Rep) in green. (Scale bar, 20 μm.) (E) Immunostaining of the pronephric duct in 1-dpf embryo showing overexpressed Reptin-eGFP (Upper, green) and endogenous Seahorse (Sea, red). Overexpressed Myc-eGFP is shown (Lower) as a negative control. Arrowheads point to puncta positive for both Reptin eGFP and Seahorse. (Scale bar, 10 μm.) |
|
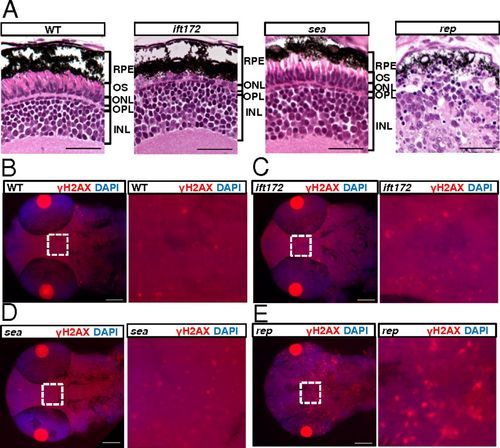
reptinhi2394 mutants show cilia-independent phenotypes. (A) Sections of the eye at 5 dpf. RPE, retinal pigment epithelium; OS, outer segment; ONL, outer nuclear layer; OPL, outer plexiform layer; INL, inner nuclear layer. (Scale bar, 20 μm.) (B?E) The head and eye region at 2-dpf mutants stained with an anti-γH2AX antibody in red. The boxed regions (Left) of B?E are magnified on corresponding Right. The pair of bright red circles in each image is the pair of lenses. (Scale bar, 100 μm.) WT, wild type; ift172, ift172hi2211 mutant; sea, seahorsehi3308 mutant; rep, reptinhi2394 mutant. |
|
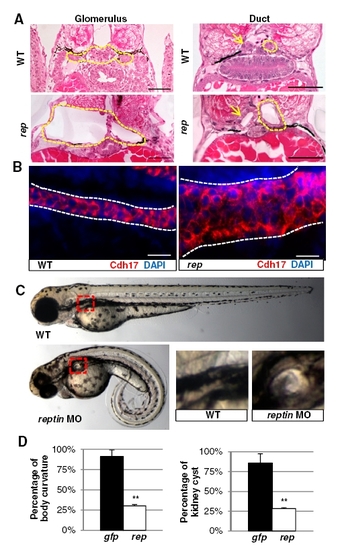
Reptinhi2394 mutants and reptin morphants display cilia-associated phenotypes. (A) Cross-sections of the glomerular?tubular region and the posterior pronephric duct region of a reptinhi2394 mutant (rep) and a wild-type sibling (WT) at 5 dpf. Yellow dotted lines show the border of the glomerular?tubular region on the Left and the duct on the Right; yellow arrows point to the duct on the Left. (Scale bar, 50 μm.) (B) Whole-mount immunostaining with anti-Cdh17 (Cdh17, red) showing increased diameter of the pronephric duct (bordered by white line) in a side view of a reptinhi2394 mutant (rep) compared with a wildtype embryo (WT) at 4 dpf. (Scale bar, 20 μm.) (C) Reptin morphant (rep MO) at 3 dpf displaying kidney cyst (red box) and body curvature, compared with a control MO injected embryo (WT). The kidney regions are magnified at Lower Right. (D) Wild-type embryos coinjected with reptin MOs and reptin (with 5 mismathed nucleotides) mRNA (rep) showing reduced percentages of body curvature (Left) and kidney cyst (Right), compared with the reptin MOs and eGFP mRNA coinjection group (gfp). Data are represented as mean + SD from three replicates. **P < 0.01. EXPRESSION / LABELING:
PHENOTYPE:
|
|
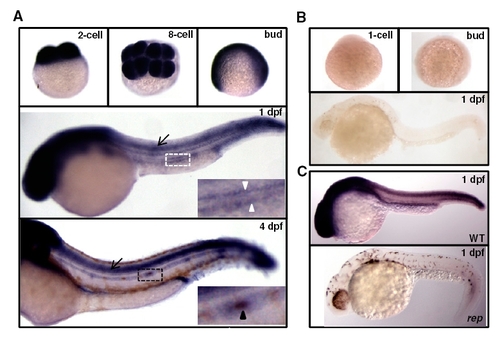
The distribution pattern of reptin transcripts during zebrafish development. (A) In situ hybridization (ISH) for reptin on wild-type embryos fixed at different stages. Black arrows point to the neural tube. Insets are enlarged images showing the bilateral pronerphric ducts pointed out by white arrowheads (boxed by white dotted line in the Middle) and the lateral line organ pointed out by a black arrowhead (boxed by black dotted line at Bottom). (B) Sense control for A. (C) ISH for reptin on a 1-dpf reptinhi2394 mutant (rep, Lower) and a wild-type sibling (WT, Upper). |
|
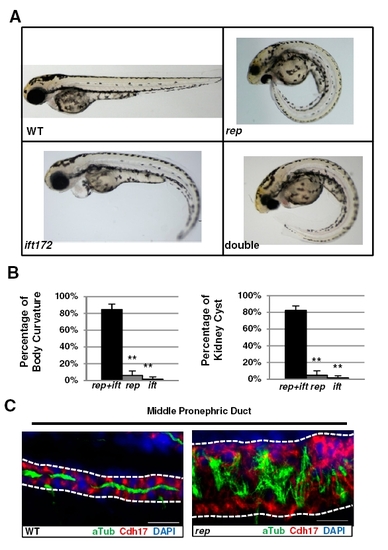
Reptin genetically interacts with the cilia biogenesis gene ift172, but is dispensable for cilia biogenesis. (A) Phenotypes of reptinhi2394; ift172hi2211 double mutants (double) and single mutants of either genes at 4 dpf. WT, wild-type sibling. (B) Percentage of embryos showing body curvature (Left) and kidney cysts (Right). A total of 82.2% embryos show kidney cyst formation and 84.6% embryos show body curvature in the reptin MO and ift172 MO coinjection group (rep+ift), compared with 4.7% cyst formation and 5.9% body curvature in the reptin MO and control MO coinjection group (rep) or 1.5% cyst formation and body curvature in the ift172 MO and control MO coinjection group (ift). Data are represented as mean + SD from three replicates. **P < 0.01. (C) Immunostaining showing cilia (stained with antiacetylated tubulin in green) in reptinhi2394 mutants in the middle region of the pronephric duct (stained with anti-Cdh17, in red, lined with dotted lines). WT, wild type; rep, reptinhi2394. (Scale bar, 20 μm.) |
|
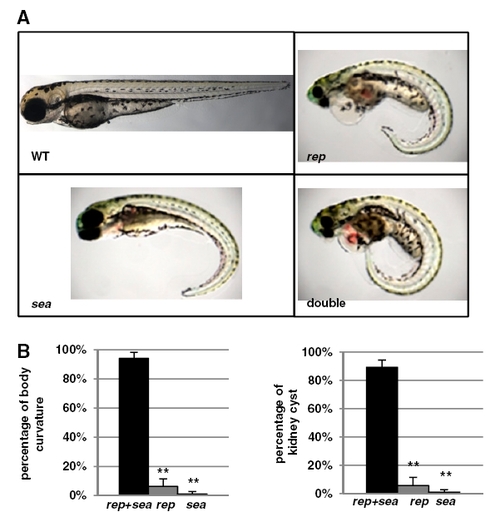
Reptin genetically interact with seahorse/lrrc6. (A) Reptinhi2394; seahorsehi3308 double mutants (double) show similar cystic kidney phenotype as single mutants of either gene at 4 dpf. (B) Percentage of embryos showing body curvature (Left) and kidney cysts (Right). A total of 89.3% embryos show kidney cyst formation and 94.1% embryos show body curvature in the reptin MO and seahorse MO coinjection group (rep+sea), compared with 1% cyst formation and body curvature in the seahorse MO and control MO coinjection group (sea) or 5.7% cyst formation and 6.2% body curvature in the reptin MO and control MO coinjection group (rep). Data are represented as mean + SD from three replicates. **P < 0.01. PHENOTYPE:
|

