- Title
-
Pax4 is not essential for beta-cell differentiation in zebrafish embryos but modulates alpha-cell generation by repressing arx gene expression
- Authors
- Djiotsa, J., Verbruggen, V., Giacomotto, J., Ishibashi, M., Manning, E., Rinkwitz, S., Manfroid, I., Lvoz, M., and Peers, B.
- Source
- Full text @ BMC Dev. Biol.
|
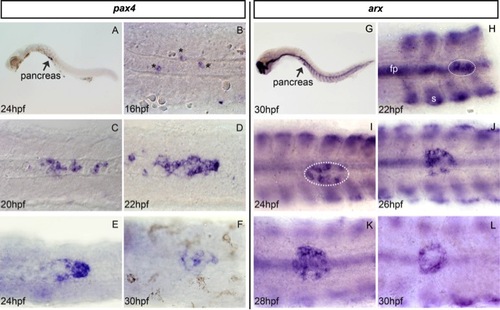
pax4 and arx are expressed in the pancreatic dorsal bud in zebrafish embryos. Whole-mount in situ hybridization (WISH) performed with pax4 (A ? F) and arx (G ? L) probes at different developmental stages (hpf : hours post-fertilization). (A and G) Lateral view, anterior to the left, original magnification 40x. (B ? F and H - L) Ventral views, anterior to the left of yolk-free embryos, original magnification 400x. Dotted lines : dorsal pancreatic bud; fp: floor plate; s: somites. EXPRESSION / LABELING:
|
|
Identification of pax4 and arx expressing cells by double fluorescent in situ hybridization. All images are confocal optical sections of the dorsal pancreatic bud with anterior part to the left. The probes and the developmental stages are respectively indicated at the top and the bottom in each image. All views are ventral, except images P, Q, R and S which are lateral views. arx transcripts are detected in almost all glucagon+ (A, B), in some ghrelin+ (C, D) cells and in many isl1+ cells (H); absence of co-staining between arx and insulin (E, F) and somatostatin (G). pax4 transcripts are not detected in insulin+ (I - K) and most glucagon+ cells (L). pax4 is expressed in many somatostatin (M) and a few ghrelin (N) expressing cells. Partial co-staining of pax4 probe with a cocktail of insulin, glucagon, somatostatin and ghrelin probes (horm)(O), with isl1 (P) and sox4b (Q) probes. Absence of co-staining between pax4 and nkx6.1 (R). S: Schematic representation of the multi-layer organization of the pancreatic dorsal bud at 24 hpf including pax4 expression. Scale bar = 20 μm. astérisks (*) indicate double positive cells. EXPRESSION / LABELING:
|
|
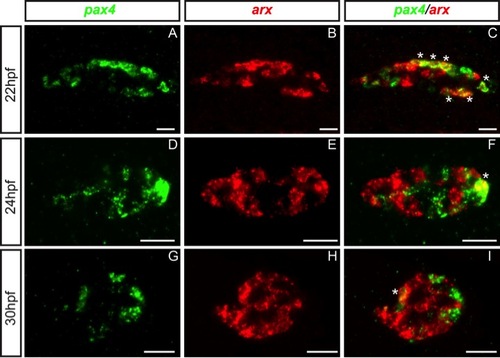
Coexpression of pax4 and arx in some cells during pancreatic cell differentiation. Ventral view of the pancreas area analyzed by double fluorescent WISH showing expression of pax4 and arx at 22 hpf (A - C), 24 hpf (D - F) and 30 hpf (G- I). Confocal projection images with anterior part to the left. Scale bar = 20 μm. astérisks (*) indicate double positive cells. EXPRESSION / LABELING:
|
|
arx is required for the differentiation of α-cells. (A - H) Ventral views of the pancreas area from embryos analyzed by WISH, anterior to the left. Pancreatic expression of insulin (A, B), somatostatin (C, D), ghrelin (E, F) and glucagon (G, H) in control morphants (A, C, E, F) and arx morphants (B, D, F, G) at 30n hpf. Quantifications (I - K) represent the number of positive cells per embryo for control morphants and arx morphants. Original magnification 400x. |
|
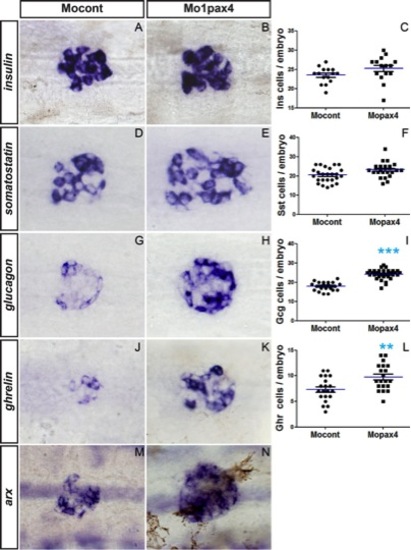
Pax4 is not required for β-cell differentiation. (A - J) Ventral views of the pancreas area from embryos analyzed by WISH, anterior to the left. Pancreatic expression of insulin (A, B), somatostatin (C, D), ghrelin (E, F), glucagon (G, H) and arx (I, J) in control morphants (A, C, E, F, I) and pax4 morphants (B, D, F, G, J) at 30 hpf. Quantifications (K, L, M, N) represent the number of positive cells per embryo for control morphants and pax4 morphants. Asterisks (*) indicate that the difference between cell number in control morphants and pax4 morphants is statistically significant by Student?s t-test (**: P<0.003; ***: P<0.0001). Original magnification 400x. |
|
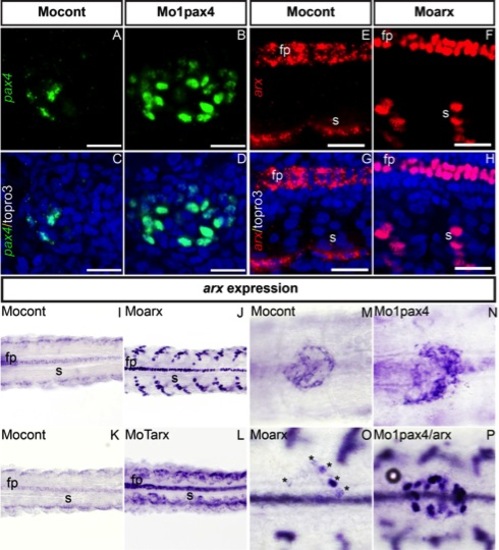
Up-regulation and nuclear localization of pax4 and arx altered transcript. (A?D) Confocal images of the pancreas area of 30 hpf embryos co-stained for pax4 mRNA (green) and Topro3 (blue) to visualize all cell nuclei, in control morphants (A-C) and pax4 morphants (B-D). Scale bar = 20 μm. (E-H) Confocal images of the pancreas area of 30 hpf embryos analyzed by fluorescent WISH with arx probe (red) and stained for Topro3 (blue). arx expression in somites and the floor plate of control morphants (E, G) and of arx morphants (F, H). Scale bar = 20 μm. (I-L) Ventral view of WISH 30 hpf embryos showing upregulation of arx transcripts in somites and floor plate in Moarx (J) and MoTarx (L) morphants. Original magnification 200x. (M ? P) Ventral views of the pancreas area from embryos analyzed by WISH showing expression of pax4 in control morphants (M), pax4 morphants (N), arx morphants (O) and double pax4/arx morphants (P). Original magnification 400x. Anterior part of all the embryos is in the left. Asterisks indicate arx positive cells. fp: floor plate, s: somite, cont: control morphant. EXPRESSION / LABELING:
|
|
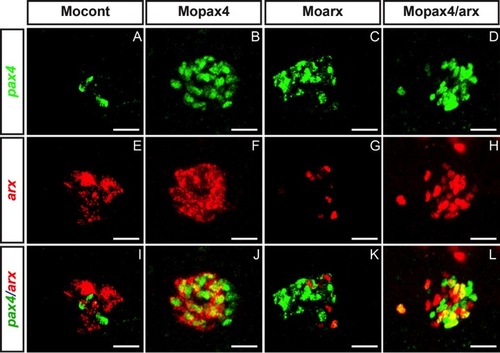
Expression of pax4 and arx transcripts in single and double morphants. Confocal projection of the pax4 domain (A ? D), arx domain (E ? H) and merged channels color (I ? L) at 30 hpf in control morphants (A, E, I), pax4 morphants (B, F, J), arx morphants (C, G, K) and double pax4/arx morphants (D, H, L) analyzed by fluorescent WISH. Scale bar = 20 μm. Ventral view, anterior to the left. EXPRESSION / LABELING:
|
|
Identity of pax4+ and arx+ cells following Pax4 and Arx inactivation. (A ? F) Double fluorescent WISH performed on 30 hpf embryos showing expression of pax4 transcripts (green) in the different pancreatic cell types of control morphants (A, C, E, G) and in pax4 morphants (B, D, F, H). All panels display ventral vues except panels D and H which are lateral vues. (I ? N) Confocal images of pancreatic area with arx probe and various pancreatic hormones at 30 hpf in control (I-L) and double pax4/arx morphants (M-P). Anterior part to the left. Scale bar = 20 μm. Asterisks (*) indicate double positive cells. EXPRESSION / LABELING:
|
|
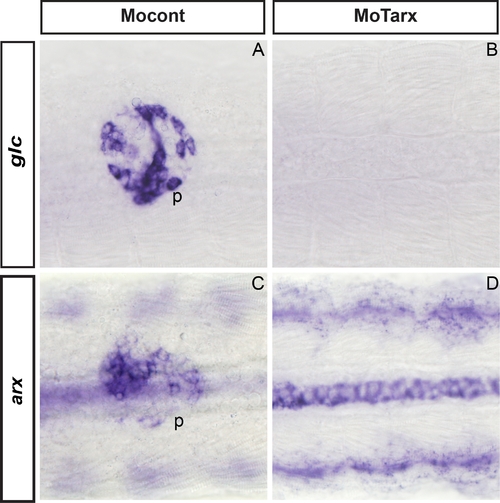
arx knock-down using the translation blocking morpholino MoTarx. Analysis by WISH of glucagon expression (A, B) and of arx expression (C,D) in control embryos (A,C) and in embryos injected with MoTarx morpholino (MoTarx) (B,D). Ventral view, anterior to the left of pancreatic area at 400X magnification p: pancreas. Note the loss of pancreatic arx expression in MoTarx morphants and the cytoplasmic localisation of arx transcripts in both control and morphants. |
|
Expression of the Tg(ARX enhancer:GFP) transgene is increased by arx knock-down. Representative images of Tg(ARX_enhancer:GFP) transgenic embryos that have been injected with arx morpholino in comparison to uninjected embryos and embryos injected with a standard control morpholino. Fluorescent overview images were taken with an inverted microscope (A), while fluorescent intensities were measured by confocal microscopy (B) and quantified (C) as described in Materials and Method. A. Lateral view of 2 dpf Tg(ARX_enhancer:GFP) embryos injected with ARX morpholino (2ng), control morpholino (2ng) or uninjected. B. Maximum intensity projection of confocal stack of 3 dpf Tg(ARX_enhancer:GFP) embryos (dorsal view) injected with ARX morpholino (2ng), control morpholino (2ng) or uninjected. C. Fluorescent intensity measurements. Means of 10 embryos ± Standard Deviation. Different from control at *P < 0.001. |

