- Title
-
Expression of Hairy/enhancer of split genes in neural progenitors and neurogenesis domains of the adult zebrafish brain
- Authors
- Chapouton, P., Webb, K.J., Stigloher, C., Alunni, A., Adolf, B., Hesl, B., Topp, S., Kremmer, E., and Bally-Cuif, L.
- Source
- Full text @ J. Comp. Neurol.
|
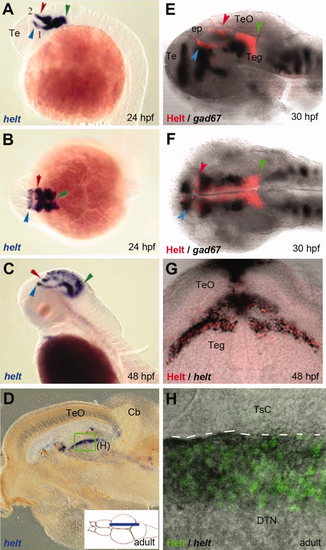
Costaining of embryos and adults for helt mRNA and Helt protein expression demonstrates the specificity of the anti-Helt antibody. A?C: Expression of helt revealed by in situ hybridization on whole-mount embryos (A,C: sagittal views, B: dorsal view; all embryos oriented anterior left, stages indicated). Major expression is detected in the tegmentum. Green arrows point to the posterior expression limit at the midbrain?hindbrain boundary, and red and blue arrows point to anterior expression limits of two tegmental stripes along the borders of pretectum and zona limitans intrathalamica, respectively. This expression is in agreement with the profile described for mouse Helt (Miyoshi et al.,2004; Guimera et al.,2006a; Nakatani et al.,2007). D: Expression of helt revealed by in situ hybridization on a parasagittal section of the adult brain (see cartoon). The midbrain area is shown. E?H: Expression of Helt revealed by the 4A8 antibody (red or green staining) compared with in situ hybridization (black staining) for helt (G,H) or gad67 (E,F) used as landmark. On whole-mount embryos (E,F), note the similar profile of 4A8 with helt mRNA (A,B). G: Cross-section of a 48-hpf embryo at posterior midbrain levels (position indicated by the green arrowhead on C). Note that helt mRNA (black) and immunostainings are found in the same cells. H: Sagittal section of an adult brain (position boxed in D). Again, note the coincidence of helt expression with the 4A8 immunostaining. |
|
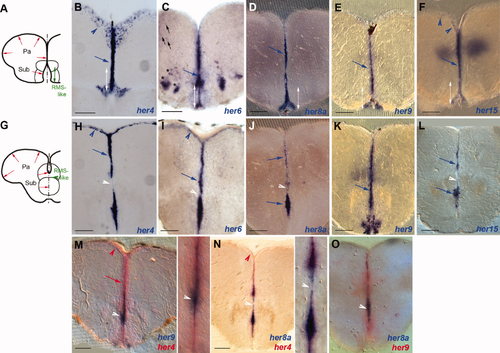
Expression of her genes in the adult telencephalon. Expression was detected by in situ hybridization (blue and red stainings, color-coded) on 80-μm vibratome cross-sections at anterior (A?F) or more posterior (G?O) levels, both located rostral to the preoptic area. A,G: Schematic representation of the sections at the levels illustrated; red arrows indicate the ventricular zone (VZ), and the green double arrow and green arrowhead point to the RMS-like stripe. B?F,H?O: her4, -6, -8a, -9, and -15 are largely coexpressed at the VZ (blue arrows), although her6 transcripts are found only weakly in the anterior aspect of the RMS-like stripe (indicated by white double arrows). Some her6-expressing cells can also be detected in the parenchyma of the subpallium (asterisks) and pallium (black arrows); the latter showed quite variable expression levels between samples. her4 Expression is strongest and clearly visible also in the dorsal pallium (blue arrowheads). On posterior sections (level G), note that her9 expression is not interrupted across the RMS-like stripe (see also white arrowheads in M?O). We did not detect expression of her5 or helt in the telencephalon using in situ hybridization. Pa, pallium; Sub, subpallium. Scale bars = 100 μm. EXPRESSION / LABELING:
|
|
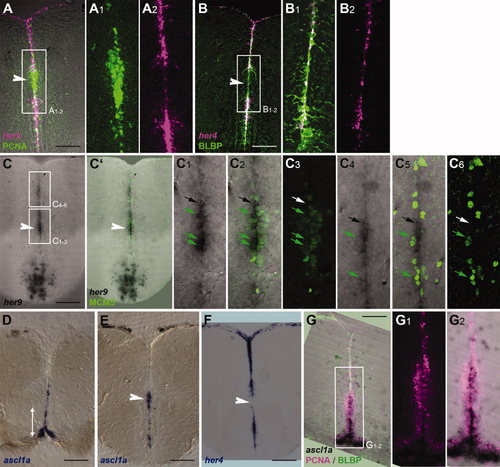
Compared expression of her4 and her9 genes in the adult telencephalon with radial glia and actively dividing neurogenic domains. her Gene expression was detected by in situ hybridization on 80-μm vibratome cross-sections at levels as depicted in Figure 2A (for D,G) or Figure 2G (all other panels). A?C6 and G?G2 are confocal views. The white double arrow in D indicates the approximate extent of the RMS-like stripe at this very anterior level; in other panels, the white arrowhead points to the position of the RMS. A?B2: Expression of her4 (magenta) compared with the proliferation marker PCNA (A?A2) or the radial glia marker BLBP (B?B2; immunocytochemistry, green) by using confocal microscopy demonstrates the exclusion of her4 transcripts from dividing cells and their expression in radial glia. A1 and A2 are single-channel views of the area boxed in A. C?C6: Expression of her9 (black) compared with the proliferation marker MCM5 (green) demonstrates prominent her9 expression within the RMS-like domain. C2 is the same section as in C showing the overlay of the her9 and MCM5 stainings. C1?6 are high magnifications of the areas boxed in C. Within the RMS, numerous cells coexpressing her9 and MCM5 can be seen (green arrows; C1?3), although cells expressing her9 but negative for MCM5 are also visible (black arrow). In more dorsal ventricular locations (C4?6), her9 expression is decreased as well as the proportion of MCM5-positive cells within the her9-positive population. D,E: Expression of ascl1a (blue) revealed by in situ hybridization at levels shown in Figure 2A and G, respectively. Note the prominent expression of ascl1a within the RMS. F: Expression of her4 at the same level as section E shows that the her4 and ascl1a domains are essentially complementary. G?G2: Compared expression of ascl1a (in situ hybridization, black), PCNA (magenta), and BLBP (green) at anterior telencephalic levels. G1 and G2 are high magnifications of the area boxed in G depicting PCNA only (G1) or the merged PCNA and ascl1a patterns (G2). Note that ascl1a expression is strongest within the RMS. Scale bars = 100 μm. EXPRESSION / LABELING:
|
|
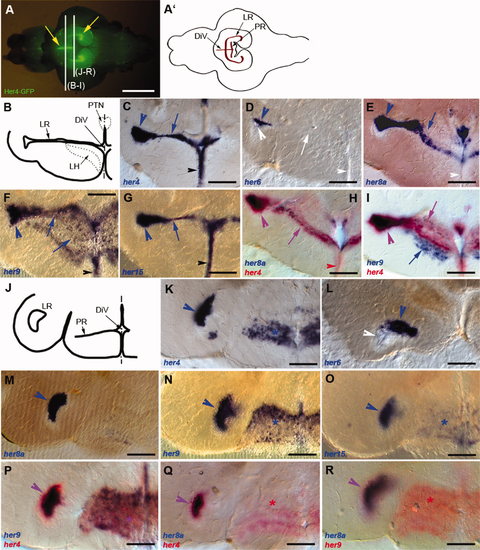
Expression of her genes in the hypothalamus. Expression was detected using in situ hybridization (blue and red stainings) on 80-μm vibratome cross-sections at anterior (B?I) or more posterior (J?R) levels, as indicated in A. A: Ventral view of the dissected brain of a Tg(her4:egfp) animal (Yeo et al.,2007; anterior left) observed under fluorescence stereomicroscopy and highlighting the shape of the hypothalamic ventricles (yellow arrows). A2: Schematized view of A with the extensions of the diencephalic ventricle in the hypothalamus highlighted in brown. B,J: Schematic representations of the sections at the levels illustrated in C?I and K?R, respectively. C?I,K?R: Compared expression of her4, -6, -8a, -9, and -15 in single and double ISH (color-coded). In C?I, large arrowheads and arrows point to the LR and small arrowheads to the medialmost aspect of the DiV. In K?R, large arrowheads point to the LR, and asterisks indicate the PR. White labels point to an absence of staining, and purple labels to costaining in double ISH panels. Note the strong coexpression of all genes in the lateralmost extension of the LR (arrowheads), whereas the more medial part of the LR extension is conspicuous for its absence of her6 expression at all anteroposterior levels (D,L). Note also the lack of her8a expression in the PR (M,Q). Finally, her9 also labels the LH (I, blue arrow). DiV, diencephalic ventricle; LH, lateral hypothalamic nucleus; LR, lateral recess; PR, posterior recess; PTN, posterior tuberal nucleus. Scale bars = 1 mm in A; 100 μm in B?R. EXPRESSION / LABELING:
|
|
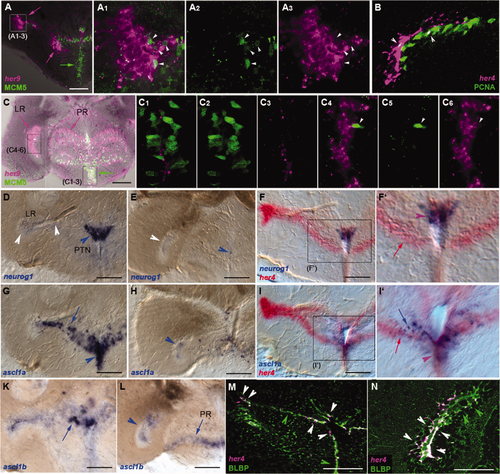
Expression of her genes in the adult hypothalamus characterizes radial glia as opposed to actively dividing neurogenic domains. her Gene expression was detected by using in situ hybridization on 80-μm vibratome cross-sections at levels equivalent to Figure 5B (for A?A3,D,F,G,I,K,M) and 5J (for B?C6,E,H,L,N). A?C6: Comparison of the expression of her4 and her9 (magenta) with the proliferation markers MCM5 or PCNA (green; as indicated) analyzed under confocal microscopy revealed that most domains expressing her genes (magenta arrows) are largely nonproliferating (green arrows). Upon close examination, a few cells coexpressing both marker types can be seen (white arrowheads). A1?3 and C1?6 are high magnifications of the areas boxed in A and C, respectively. B is a high magnification of the LR. D?L: Comparison of the expression of her4 (red) with the proneural genes neurog1, ascl1a, and ascl1b (blue, as indicated) shows apparent coexpression along the medial aspect of the DiV (see F2,I2, purple arrowheads), whereas the patterns diverge more laterally (I2, blue and red arrows). Note the complementary patterns of neurog1 and ascl1 expression dorsal and ventral to the branching point of the LR, respectively. neurog1 Tentatively labels the PTN. Note also the prominent expression of her4 along the LR, contrasting with the weak or absent transcription of proneural genes. Here arrows point to expression along the medial aspect of the LR or the PR, and arrowheads point to the tip of the LR and the DiV. White arrowheads indicate ventricular zones of nonexpression. F2 and I2 are high magnifications of the boxed areas in F and I, respectively. M,N: Costaining for her4 (magenta) and the radial glia protein BLBP (immunocytochemistry, green) showed strong coexpression of the two markers all along the hypothalamic ventricles in confocal analysis (white arrowheads). Some BLBP-positive, her4-negative cells were observed (green arrowheads). LR, lateral recess; PR, posterior recess; PTN, posterior tuberal nucleus. Scale bars = 100 μm. EXPRESSION / LABELING:
|
|
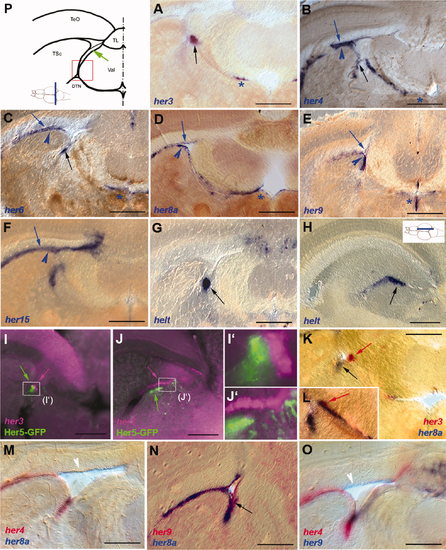
Expression of her genes in the adult posterior midbrain. Expression was detected by in situ hybridization (blue and red stainings) or immunocytochemistry (GFP expression in the Tg(her5:egfp) line, green staining) on 80-μm vibratome cross-sections as depicted, except for H (sagittal section, level indicated). A?H: Expression of single genes. The thin blue arrowheads point to the tectal periventricular gray zone, the thick blue arrowheads to expression along the VZ of the torus semicircularis, and the black arrows to expression in the IPZ, when visible. Note the restricted expression of her3 and helt and that expression of all genes (except for her5 and helt) is also visible in medial locations along the tectal ventricle (stars). I?L: Comparison of the expression of her3 (I?J2: magenta, K,L: red), Her5-GFP (green), and her8a (blue) demonstrates the immediately adjacent locations of positive cell groups. M?O: Comparison of the expression of her4, her8a, and her9 highlights the virtually identical profiles of these genes. The white arrowheads point to fading expression in areas where the tectal ventricle is large, and the black arrow points to the IPZ. P: Schematic representation of the section levels illustrated in A?G,I?O. The red box delimits the area magnified in I2,J2, and the green arrow points to the isthmic proliferation zone (IPZ). DTN, dorsal tegmental nucleus; TeO, optic tectum; TL, torus longitudinalis; TSc, torus semicircularis; Val, valvula cerebelli. Scale bars = 200 μm in A?G,K; 150 μm in H?J2 100 μm in M?O. EXPRESSION / LABELING:
|
|
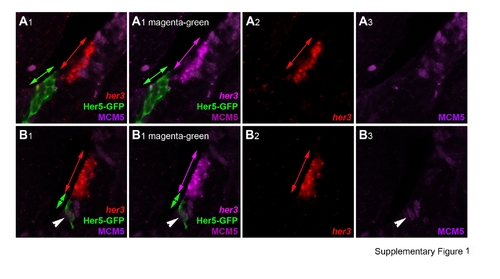
her Gene expression in the adult posterior midbrain in both quiescent progenitors and the actively neurogenic IPZ. her Gene expression was detected by in situ hybridization (A?G) or immunocytochemistry (Her5-GFP in A,B,H,I; Helt in H,I) on 80-μm vibratome cross-sections at levels equivalent to Figure 8P. A?D: Expression of her3 (A,B, red), her4 (D, magenta), Her5-GFP (A,B, green), and her9 (C?C4, magenta) compared with the proliferation markers MCM5 (A,B, purple; C?C4, green) or PCNA (D; green) and analyzed under confocal microscopy demonstrates the near exclusion of her transcripts from dividing cells (see purple and green arrows in A,C). In the ventralmost aspect of the IPZ, however, a few proliferating, her-positive cells can be seen (arrowheads in A?D). Single channels, as well as a magenta-green version, corresponding to A and B are illustrated again in Supporting Information Figure 1. E,F: Comparison of the expression of her4 (red) with the proneural markers neurog1 and ascl1a (blue). Note the very distinct expression of proneural genes at the ventral IPZ tip in the domain coexpressing her genes (purple arrowheads). Blue arrows in F point to neuroblasts apparently delaminating from this domain. G: Comparison of her4 (red) and BLBP (green) expression analyzed using confocal microscopy demonstrates expression of BLBP by all (or most) her4-positive cells. The section is the same as in D. Note the absence of her4 transcripts in radial glia lining the optic tectum (green arrow) and the nonglial nature of the IPZ (white arrowhead). H,I: Comparison of the expression of Helt (red) with Her5-GFP (green) and PCNA or BLBP (blue in H,I, respectively) on sagittal sections of the IPZ (same orientation as in Fig.8H). Note the adjacent location of Helt- and Her5-expressing cells and the coexpression of PCNA by a few Helt-positive cells only (purple arrowheads in H), although most of the Helt domain is nonproliferating (red arrows in H) and BLBP-positive (purple arrowheads in I). The blue arrows in I point to the BLBP-positive, Helt-negative domain lining the optic tectum ventricle. Scale bars = 20 μm in A,B; 50 μm in C,D,G?I; 100 μm in E,F. EXPRESSION / LABELING:
|
|
|

