- Title
-
The miR-143-adducin3 pathway is essential for cardiac chamber morphogenesis
- Authors
- Deacon, D.C., Nevis, K.R., Cashman, T.J., Zhou, Y., Zhao, L., Washko, D., Guner-Ataman, B., Burns, C.G., and Burns, C.E.
- Source
- Full text @ Development
|
miR-143 is expressed in the zebrafish embryonic heart. Whole-mount in situ hybridization for miR-143. (A,B) At 36 and 38 hpf, miR-143 is expressed throughout the heart tube and outflow tract (OFT). Anterior views. (C,D) At 48 hpf, miR-143 is expressed in the ventricle and OFT. Lateral view (C) and magnification of the heart (D). (E) Ventricular miR-143 expression at 72 hpf; OFT expression is high at this stage (arrowhead). Expression is also observed in pharyngeal cells. (F) At 5 dpf, transcripts are detected in the ventricle, OFT and in a population of pharyngeal cells. Plastic sections. (G) Magnification of the boxed region in F; miR-143 transcripts are detected throughout the ventricular wall. O, outflow tract; V, ventricle; A, atrium; Lu, lumen. |
|
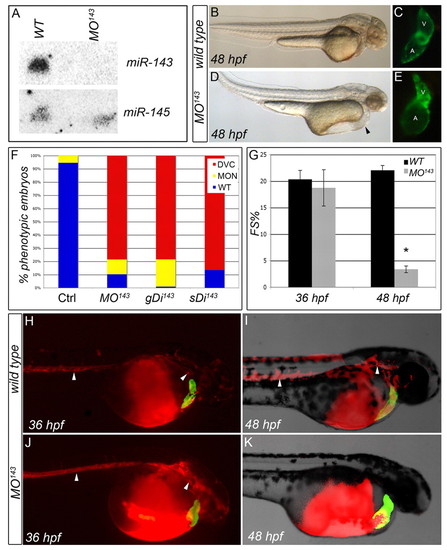
Inhibition of miR-143 biosynthesis results in structural malformations of the cardiac chambers and decreased cardiac function. (A) Northern analysis. No mature miR-143 can be visualized in MO143 zebrafish embryos, whereas miR-145 expression appears unaltered. (B-E) Inhibition of miR-143 biosynthesis results in ventricular collapse and atrial dilation. Lateral views (anterior to the right) are shown of control and MO143-injected Tg(cmlc2::GFP) embryos at 48 hpf imaged under transmitted (B,D) and fluorescent (C,E) light. Arrowhead in D indicates pericardial edema. (F-K) Inhibition of miR-143 compromises ventricular function between 36 and 48 hpf. (F) The percentage of animals with a contractile defect at 48 hpf elicited by three independent morpholinos. DVC, decreased ventricular contractility (red); MON, monster (alive but severely deformed and not accurately scorable for the heart defect; yellow); WT, wild type (blue). (G) Contractility as percentage fractional shortening (FS%) in WT and MO143 hearts at 36 and 48 hpf. *, P=8.03x10⁻¹⁵; error bars represent ± s.e.m. (H-K) Microangiography of WT and MO143 embryos at 36 and 48 hpf. Arrowheads indicate circulating beads in the head and trunk. Red, beads; green, myocardium. |
|
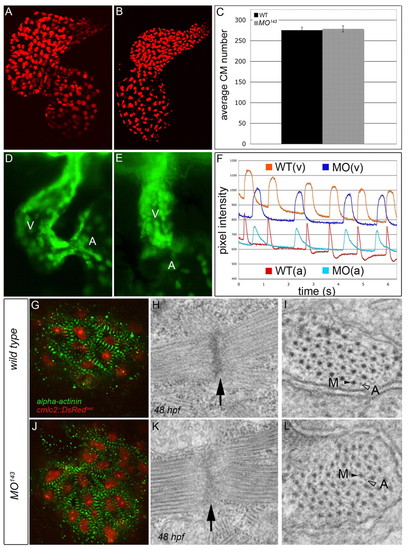
miR-143 is dispensable for proper myocardial and endocardial cell specification, conduction system development and sarcomere assembly. (A,B) Flattened confocal images of 72 hpf WT (A) and MO143 (B) zebrafish hearts carrying a transgene that expresses DsRed2 in cardiomyocyte (CM) nuclei. (C) The average number of total CMs. Error bars represent ± s.e.m. (D,E) WT (D) and MO143 (E) hearts at 48 hpf carrying an flk1::GFP transgene to highlight the endocardium. The ventricle is shown predominantly. (F) Calcium Green fluorescence levels over time in the atria (bottom) and ventricles (top) of 48 hpf WT (blue) and MO143-injected (red) embryos. (G,J) WT and MO143-injected Tg(cmlc2::DsRednuc) embryos (red nuclei) stained with anti-α-actinin (green) to visualize Z-bands at 48 hpf. (H,I,K,L) TEMs of WT and MO143 ventricles at 48 hpf showing Z-disks (H,K, arrows) and sarcomeric bundles (I,L) with organized myosin (M, black arrowheads) and actin (A, open arrowheads) fibers. EXPRESSION / LABELING:
PHENOTYPE:
|
|
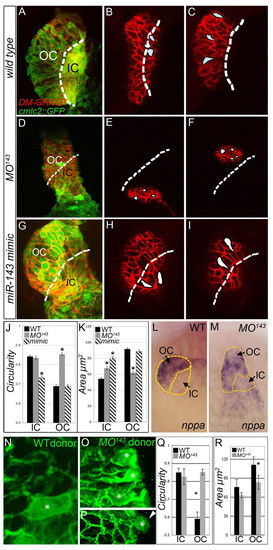
miR-143 is required and sufficient for CM growth and elongation. (A-I) At 48 hpf, WT, MO143-injected and miR-143-overexpressing zebrafish embryos carrying a cmlc2::GFP transgene (green) were immunostained with anti-DM-GRASP antibodies (red) and imaged by confocal microscopy. Shown are flattened z-stacks (A,D,G) and individual sections (B,C,E,F,H,I) from each group. Dashed lines demarcate the approximate outer curvature/inner curvature (OC/IC) boundary based on proximity to the atrioventricular junction. (J,K) The circularities (J) and areas (K) of cells in the IC and OC of WT, MO143 and miR-143-overexpressing (mimic) embryos. Asterisk indicates statistical significance compared with WT. (L,M) In situ hybridization for nppa expression in WT (L) and MO143 (M) animals. The perimeters of the ventricles are highlighted with dashed yellow lines and the OC (nppa expressing) and IC (nppa non-expressing) populations are indicated. (N-R) Chimeric ventricles were derived by transplantation of WT (N,Q,R) or MO143 (O,P,Q,R) blastula cells carrying the cmlc2::GFP transgene. (N-P) Mosaic hearts were immunostained with anti-DM-GRASP to outline cell borders. Representative images of WT (N) and MO143 cells (O,P, green, *) in the OC. A morphant cell is shown projected from the ventricular wall (P, arrowhead). (Q,R) The average circularity and area for WT and MO143 cells in the OC and IC. |
|
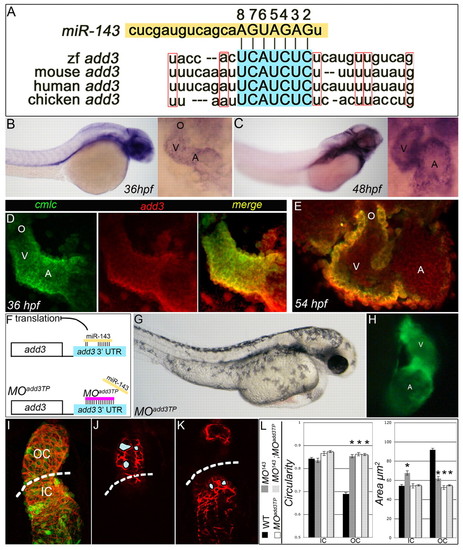
add3 is a physiologically relevant target of miR-143 repression. (A) The conserved miR-143 seed sequence (2-8) base pairing with its conserved target sequence in the add3 3′ UTR. (B,C) In situ hybridization for add3. Left, lateral views; right, high-magnification anterior views of the zebrafish heart. (D,E) Double-fluorescence in situ hybridization at 36 hpf (D) shows overlapping cmlc2 (green) and add3 (red) expression, which is also visible at 54 hpf (E). (F) The add3 target protector morpholino experimental strategy. (G,H) Tg(cmlc2::GFP) embryos were injected with MOadd3TP and imaged at 48 hpf under transmitted (G) and fluorescent light (H). Lateral views. As with MO143 embryos, MOadd3TP animals exhibit ventricular collapse, atrial dilation and compromised function (see Movie 3 in the supplementary material). (I-K) Representative sections (J,K) and a flattened z-stack (I) of a 48 hpf MOadd3TP heart carrying the cmlc2::GFP transgene (green) immunostained with anti-DM-GRASP antibody (red). Dashed lines indicate the approximate OC/IC boundary based on the proximity of cells to the atrioventricular junction. (L) The average circularity and area of WT, MO143, MOadd3TP, and MO143 + MOadd3TP IC and OC myocytes. Asterisks indicate statistical significance compared with WT; error bars represent ± s.e.m. |
|
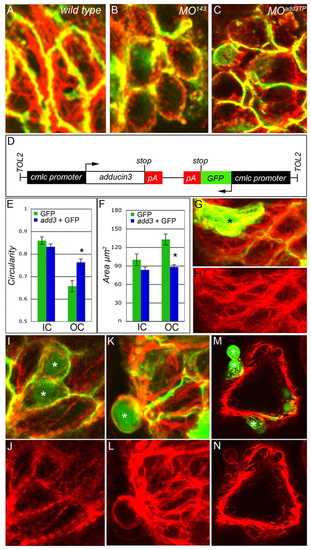
Add3 functions cell-autonomously to affect F-actin localization. (A-C) Flattened z-stacks showing phalloidin (red) and anti-DM-GRASP (green) labeling of 48 hpf WT, MO143 and MOadd3TP zebrafish cardiomyocytes within the OC. (D) The construct used to overexpress GFP and add3 (no 3′ UTR). (E,F) Cell circularity (E) and area (F) in mosaic hearts. Add3-overexpressing OC myocytes are statistically more circular (blue bar) than OC CMs labeled with GFP alone (green bar). *, P=0.00045. Error bars represent ± s.e.m. (G-N) Samples of the raw data used to generate the bar charts in E and F. Asterisks indicate GFP+ cells. (G-L) Head-on view of the ventricular OC. (M,N) Cross-section through the ventricle. (G) Merged confocal image showing WT GFP+ cells (green) and F-actin distribution (red). (H) Same image as in G but showing phalloidin staining alone. Abundant intracellular F-actin fibers can be seen in elongated GFP+ OC cells. (I,K,M) Merged confocal images showing add3-overexpressing GFP+ cells (green) and F-actin distribution (red). (J,L,N) The same images as in I,K,M but showing phalloidin staining alone. (I,J) Intracellular fibers are more visible in elongated WT cells than in add3-overexpressing neighbors (green). (K-N) Approximately half of the add3-overexpressing cells are extruded from the ventricular wall and show obvious cortical F-actin localization as compared with their WT (GFP-) neighbors. |
|
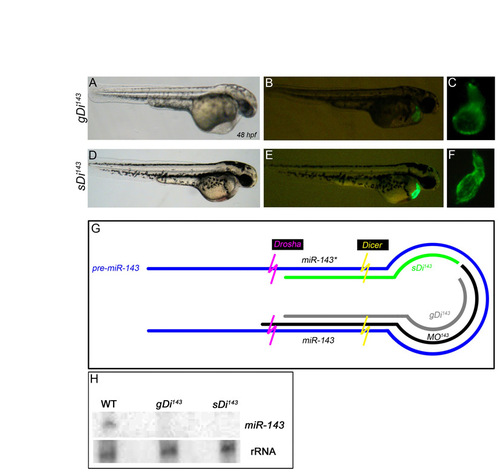
Injection of morpholinos that block Dicer cleavage of pre-miR-143 phenocopy MO143-injected embryos. (A-F) Embryos injected with two morpholinos that block Dicer cleavage on the guide (gDi143; A-C) or star (sDi143; D-F) strands of pre-miR-143 exhibit deflated, non-contractile ventricles and enlarged atria (C,F) that closely mimic hearts in MO143-injected embryos (as shown in Fig. 2F). (G) Diagram of pre-miR-143 and the target sites for three morpholinos used to inhibit Dicer and Drosha cleavage (MO143) or Dicer cleavage alone (gDi14; sDi143). (H) gDi143 and sDi143 interfere with miR-143 biosynthesis. Northern analysis of miR-143 in total RNA samples isolated from WT, gDi143 or sDi143 animals at ∼2.5 dpf. No mature miR-143 can be visualized in morphants, whereas the presence of an internal ribosomal RNA (rRNA) band appears unaltered. |
|
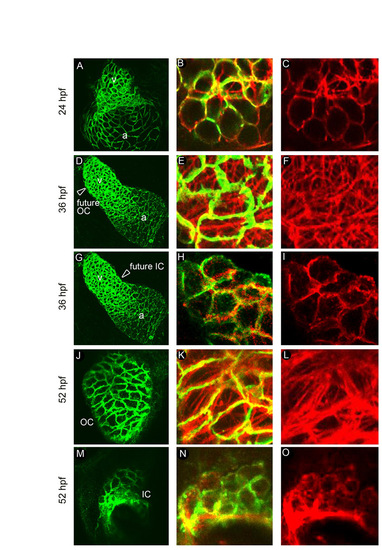
The distribution of F-actin in myocardial cells correlates with cellular shape and location during chamber emergence. (A-O) WT hearts at 24 (A-C), 36 (D-I) and 52 (J-O) hpf were co-stained with anti-DM-GRASP antibodies (green) to outline cell shape and with phalloidin (red) to visualize F-actin. Low-magnification (A,D,G,J,M) and head-on high-magnification confocal merged (B,E,H,K,N) and red only (actin only; C,F,I,L,O) images are shown. (A-C) At 24 hpf, when linear heart tube cells are circular, F-actin is largely localized to the CM cell peripheries. (D-I) At 36 hpf, presumptive future ventricular OC and IC cells, based on their location in the heart tube (arrowheads in D and G), display differential patterns of F-actin distribution. Whereas future OC cells exhibit prominent non-cortical F-actin cables (E,F), future IC cells retain F-actin at the cell peripheries (H,I). (J-O) By 52 hpf, definitive OC and IC cells show similar F-actin arrangements as their predecessors at 36 hpf. |


