- Title
-
Development of zebrafish swimbladder: the requirement of Hedgehog signaling in specification and organization of the three tissue layers
- Authors
- Winata, C.L., Korzh, S., Kondrychyn, I., Zheng, W., Korzh, V., and Gong, Z.
- Source
- Full text @ Dev. Biol.
|
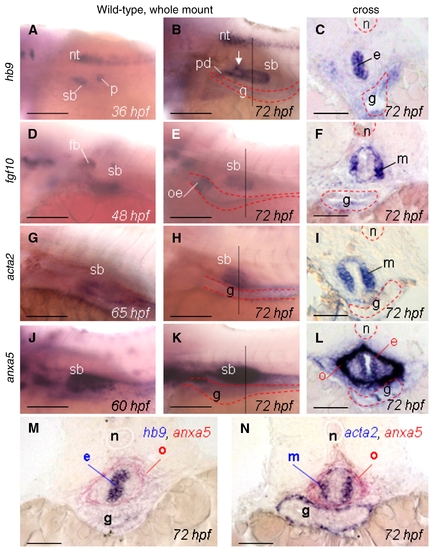
Expression of molecular markers in different tissue layers of swimbladder as detected by WISH. (A, B) Lateral view of hb9 expression in the swimbladder epithelium at 36 hpf (A) and 72 hpf (B). Additional domains of expression were observed in neural tube (nt) and endocrine pancreas (p). White arrows in (B) indicate the primordium of anterior chamber. (C) Epithelial expression of hb9 at 72 hpf shown in cross section. (D, E) Lateral view of fgf10a expression in the mesenchyme of the swimbladder at 48 hpf (D) and at 72 hpf (E). fgf10a expression was observed in fin buds (fb) starting from 48 hpf (D) and in anterior gut starting from 72 hpf (E). (F) Mesenchymal expression of fgf10a at 72 hpf shown in cross section. (G, H) Lateral view of acta2 expression in the mesenchyme at 65 hpf (G) and 72 hpf (H). (I) Mesenchymal expression of acta2 at 72 hpf shown in cross section. (J,K) Lateral view of anxa5 expression in the swimbladder at 60 hpf (J) and 72 hpf (K). (L) Expression of anxa5 at 72 hpf shown in cross section. Expression of anxa5 was observed strongly in the outer mesothelium (o) of the swimbladder starting from 60 hpf and weakly in the epithelium (e). (M) Two-colour WISH detection of hb9 (blue) and anxa5 (red) expression in the epithelium and outer mesothelium, respectively (cross section, 72 hpf). (N) Two-colour WISH detection of acta2 (blue) and anxa5 (red) expression in the mesenchymal and outer mesothelial layers, respectively (cross section, 72 hpf). Abbreviations: e, epithelium; fb, fin bud; g, gut; m, mesenchyme; n, notochord; o, outer mesothelium; p, pancreas; pd, pneumatic duct; oe, oesophagus; ph, pharynx; s, somites; sb, swimbladder. Scale bars: 250 mm in whole mount and 100 μm in cross sections. EXPRESSION / LABELING:
|
|
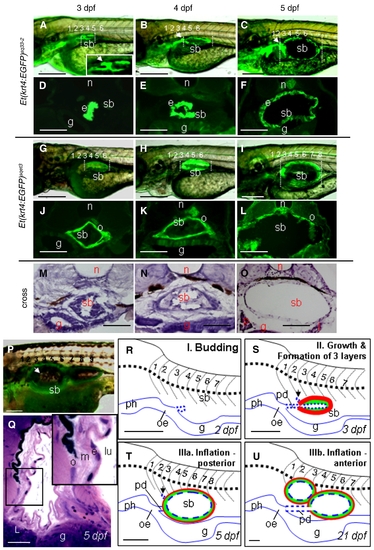
Developmental changes in morphology of the swimbladder. (A?F) EGFP expression in Et(krt4:EGFP)sq33-2 at 3?5 dpf as shown in whole mount (A?C) and cross sections (D?F). EGFP is expressed in the swimbladder epithelium (e). White arrows indicate the primordium of anterior chamber. (G?L) EGFP expression in Et(krt4:EGFP)sq3 at 3?5 dpf as shown in whole mount (G?I) and cross sections (J?L). Expression of EGFP is in the outer mesothelium (o) of swimbladder. (M?O) Cross section of swimbladder at 3?5 dpf stained with hematoxylin and eosin. (P) EGFP expression in Et(krt4:EGFP)sq33-2 at 21 dpf, showing an inflated anterior chamber (white arrow). (Q) Cross section of swimbladder at 120 hpf, three different cell layers represent epithelium (e), mesenchyme (m), and outer mesothelium (o). (R?U) Schematic representation of three phases of swimbladder morphogenesis: budding phase (R), growth phase (S) and inflation phase (T, U). At, 2 dpf, the swimbladder bud evaginates out of the anterior foregut epithelium (blue dotted line) at the level of second somite (panel R). By 3 dpf, the swimbladder bud has elongated, forming a pneumatic duct, and the swimbladder epithelium forms a sac-like structure surrounded by the mesenchymal tissue (green) and outer mesothelium (red) (panel S). The second chamber primordium (arrow) is present at the anterior tip of the main chamber (panels S and T). Inflation of the main and posterior chamber occurs at 4?5 dpf (panel T) and inflation of the anterior chamber at 20 dpf (panel U). Abbreviations: 1?7, sequence numbers of anterior somites; e, epithelium; g, gut; lu, lumen of swimbladder; m, mesenchyme; n, notochord; o, outer mesothelium; pd, pneumatic duct; oe, oesophagus; ph, pharynx; sb, swimbladder. Numbers?anterior somites. Scale bars: 250 μm in whole mount and panels R?U; 100 μm in cross sections. EXPRESSION / LABELING:
|
|
Expression pattern of ihha, shha, ptc1, and ptc2 in swimbladder as detected by WISH. (A?C) Expression of shha. Starting from 48 hpf (A) and up to 72 hpf (B), expression of shha can be found in the epithelium of the swimbladder (sb) and gut (g). A cross section of swimbladder of a 48-hpf embryo (C) indicates shha expression in the swimbladder epithelium (e) and gut (g), in addition to that in floor plate (fp). The level of section in (C) is shown by a vertical line in (A). (D?F) Expression of ihha. Similar pattern of ihha expression at 48 hpf and 72 hpf was found along the gut, pneumatic duct and swimbladder, with stronger expression in the anterior pharynx. A cross section of swimbladder of a 72-hpf embryo (F) at the level shown in (E) indicates epithelial specific ihha expression. (G,H) Expression of ptc1 (G) and ptc2 (H) at 48 hpf. (I) Cross section of a 60-hpf embryo to show ptc2 expression in the mesenchyme of the swimbladder and gut. Abbreviations: e, epithelium; fp, floor plate; g, gut; m, mesenchyme; n, notochord; pd, pneumatic duct; ph, pharynx; sb, swimbladder. Scale bars: 250 mm (A?T) and 100 μm (U?X). EXPRESSION / LABELING:
|
|
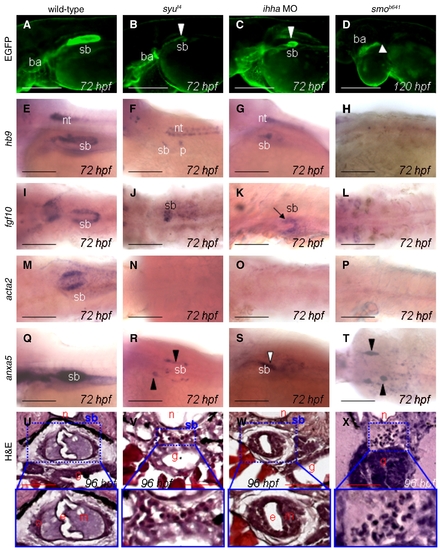
Characterization of the role of Hh pathway in swimbladder development. (A?D) EGFP expression in Et(krt4:EGFP)sq33-2 in wild type (A), syut4(B), Ihha morphants (C), and smob641 (D) backgrounds. Panel (A) shows normal swimbladder epithelium in wild type control and the swimbladder is hypoplastic in syut4(B), reduced in Ihha morphants (C), and absent in smob641 (D, white arrowheads). (E?H) Expression of hb9 was normal in wild type control (E), almost absent in syut4 (F) reduced in Ihha morphants (G), and absent in smob641 (H) at 72 hpf. (I?L) Mesenchymal fgf10 expression is normal in wild type (I), reduced and disorganized in syut4 (J), reduced and disorganized in Ihha morphants (K), and absent in smob641 (L). (M?P) Smooth muscle is absent in all experimental larvae as indicated by the absence of acta2 expression. (Q?T) Mesothelial anxa5 expression was well-organized in wild type controls (Q), disorganized and presented as two lateral stripes of cells (arrowhead) in syut4 mutants (R), organized but severely reduced in Ihha morphants (S), and significantly reduced and presented as scattered cell clusters in smob641 mutants (T). The epithelial expression in Ihha morphants is denoted by white arrowhead. (U?X) cross sections of 4 dpf control (U), syut4 (V), Ihha morphants (W) and smob641 (X) larvae stained by hematoxylin?eosin. Abbreviations: ba, branchial arches; e, epithelium; g, gut; m, mesenchyme; nt, neural tube; n, notochord; o, outer mesothelium; sb, swimbladder. Scale bars: 250 mm. EXPRESSION / LABELING:
PHENOTYPE:
|
|
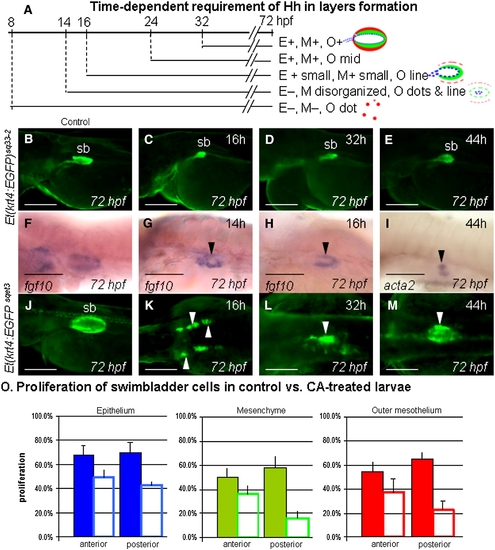
Stage-specific inhibition of Hh signaling by cyclopamine (CA). (A) Schematic representation of CA treatment experiments and observations on swimbladder development. CA treatment was performed starting from different developmental stages. Treatment results are summarized on the right. E, M and O indicate epithelium, mesenchyme and outer mesothelium respectively. ?+? indicates presence and ?-? indicates absence. 20 mM CA was used for early stage of treatment (16 hpf and earlier) and 50 mM and 100 mM CA was used for late stage of treatment (32 hpf and 44 hpf, respectively). (B?E) Expression of EGFP in swimbladder epithelium in Et(krt4:EGFP)sq33-2 embryos at 72 hpf after CA treatment stating at different time as indicated in the top-right of each panel. Panel (B) shows a control Et(krt4:EGFP)sq33-2 embryo without CA treatment. Note the hypomorphic epithelium in all treated larvae. (F?H) Mesenchymal fgf10 expression in control (F) and CA-treated larvae. Mesenchyme is present in larvae treated after 14 hpf (G), and is properly organized in larvae treated starting from 16 hpf (H). (I) Presence of acta2 expression in embryos treated with CA initiated at 44 hpf. (J?M) expression of EGFP in the outer mesothelium of control (J) and CA-treated Et(krt4:EGFP)sqet3 embryos (K?M). Note two lateral clusters of EGFP positive cells in 16 h treatment group, and partial organization in 32 h treatment group (white arrowhead). (O) Comparison of proliferation levels in control and CA-treated swimbladder showed a significant reduction in mesenchymal and outer mesothelial cell proliferation. Solid coloured bars represent control, while the open bars represent CA-treated samples. Proliferation percentage was observed in five anterior and posteriormost sections in each sample (for detail, see Supplementary Fig. 6 and legend). Abbreviations: sb, swimbladder. Scale bars: 250 μm. EXPRESSION / LABELING:
|
|
(A?B) Expression of endodermal marker foxa2 as detected by WISH. (A,B) Lateral view of foxa2 expression along the gut and swimbladder epithelium at 48 hpf (A) and 60 hpf (B). (C) Cross section of a 72-hpf embryo to show foxa2 expression in epithelium (e) of swimbladder. Abbreviations: e, epithelium; g, gut; m, mesenchyme; n, notochord; pd, pneumatic duct; oe, oesophagus; ph, pharynx; sb, swimbladder. Scale bars: 250 μm. EXPRESSION / LABELING:
|
|
Ihha morpholino knockdown analyses. (A?L) Gross morphology of embryos injected with mismatch (control) Ihha-MO (A,D,G), Ihha-MO alone (B,E,H), and Ihha-MO and p53-MO combination (C,F,I) at various developmental stages as indicated. No significant difference could be observed between embryos injected with Ihha-MO alone and those injected with the combination of Ihha-MO and p53-MO. (J?L) EGFP expression in Et(krt4:EGFP)sq33-2 to show normal swimbladder epithelium in mismatch Ihha-MO injected (J) as in uninjected wild type (not shown) and the same type of reduced swimbladder in embryos injected with Ihha-MO alone (K) or with combination of Ihha-MO and p53-MO. Scale bars: 250 μm. PHENOTYPE:
|
|
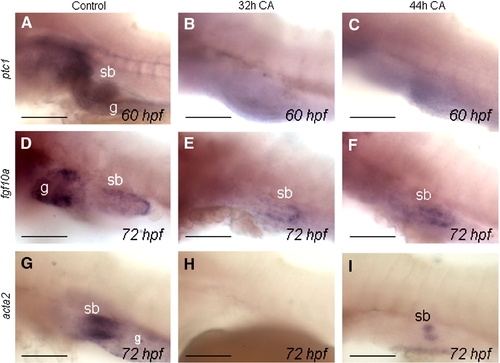
Expression of ptc1, fgf10a and acta2 in the swimbladder after CA inhibition of Hs signaling at late stages. (A?C) Expression of ptc1 in swimbladder of control and CA-treated larvae. Late stage CA treatments were performed starting from 32 hpf using 100 μM CA and from 44 hpf using 200 μM CA, which resulted in the elimination of ptc1 expression in the midline and in most of the visceral region. (D?F) fgf10a expression in the mesenchyme of swimbladder is present as normal. (G?I) Expression of acta2 is absent in 32 h CA-treated group, while present in small amount in 44 h CA-treated group, signifying a late requirement for Hh signaling in smooth muscle differentiation. Abbreviations: g, gut; sb, swimbladder. Scale bars: 250 μm. |
|
Rescue of syut4 phenotype by purmorphamine (PA). (A?C) Phenotype of control (A,D,G), untreated homozygous syut4 (B,E,H), and PA-treated homozygous syut4 larvae (C,F,I) at 24 hpf (A?C) and 54 hpf (D?F). (G?I) show EGFP expression in Et(krt4:EGFP)sq33-2. Note the presence of an anteriorly shifted swimbladder bud in rescued larvae and absence in untreated homozygous mutants. (J?O) Phenotype at 72 hpf, note the presence of a larger swimbladder bud in rescued homozygous syut4 compared to the untreated one. Swimbladder bud in rescued larvae is also located one somite more anteriorly compared to that in control. Numbers represent somites. Sb, swimbladder. Scale bars: 250 μm. PHENOTYPE:
|
|
Analyses of apoptosis and proliferation in CA-treated embryos. (A?D) Detection of apoptotic cells using TUNEL labeling (B, D) on the background of DAPI staining (A, C). Swimbladder regions are denoted in red line. No difference in apoptosis could be observed between control (A,B) and CA-treated larvae (C,D). (E?F) Proliferation assay using PCNA antibody. Note the difference in swimbladder size of control (E) and CA-treated (F) embryos. Cell nuclei are visualized with Hoechst staining, proliferating cells are indicated by red fluorescent signal. (G) Proliferation levels in serial sections across the wild type zebrafish swimbladder from the anterior to posterior. (H) Comparison of cell numbers in swimbladders of control and CA-treated larvae. All three tissue layers showed significant reduction of total cell numbers in CA-treated larvae, but the largest reduction was seen in the mesenchyme, followed by outer mesothelium. Solid coloured bars represent control, while others represent CA-treated group. (I) Proliferation profile in control and CA-treated swimbladder in the posterior region. X-axis represents consecutive sections from anterior (A) to posterior (P) for the eight posteriormost sections that have significant difference in proliferation levels. Note the downward shift of proliferation levels in CA-treated larvae compared to control in each tissue layer. Abbreviations: g, gut; n, notochord; sb, swimbladder. Scale bars: 100 μm. |
|
Expression of ptc1 and ptc2 in wild type and Ihha morphant larvae. (A?B) ptc1 expression was reduced in Ihha-MO larvae as compared to that in control. A notable reduction of expression was observable in the endoderm (white arrows) as well as in the brain region (black arrows). (C?D) Expression of ptc2 was also reduced in morphants as compared to control, although some expression remained in the brain (black arrow) and pharyngeal region (white arrows). Abbreviations: sb, swimbladder. Numbers represent anterior somites. Scale bars: 250 μm. |
Reprinted from Developmental Biology, 331(2), Winata, C.L., Korzh, S., Kondrychyn, I., Zheng, W., Korzh, V., and Gong, Z., Development of zebrafish swimbladder: the requirement of Hedgehog signaling in specification and organization of the three tissue layers, 222-236, Copyright (2009) with permission from Elsevier. Full text @ Dev. Biol.

