- Title
-
Regulation of neurogenesis by interkinetic nuclear migration through an apical-basal notch gradient
- Authors
- Del Bene, F., Wehman, A.M., Link, B.A., and Baier, H.
- Source
- Full text @ Cell
|
moks309 Mutants Have a Complex Retina Phenotype (A and B) Whole-mount lateral views of live 4.5 dpf zebrafish larvae. In moks309 mutants (B), the eyes are smaller than in the wild-type (A), but external morphology is otherwise indistinguishable. (C and D) Horizontal sections of 5 dpf retinas stained with DAPI (blue) and Zpr1 antibody (green). moks309 retinas (D) have an expanded GCL (dashed white lines), compared to wild-type (C), and no photoreceptors, as revealed by Zpr1 staining. (E and F) Coronal sections of 3 dpf retinas stained by TUNEL assay. moks309 retinas (F) have increased apoptosis, particularly in the photoreceptor layer (asterisks), compared to wild-type (E). (G and H) Horizontal sections of 48 hpf retinas expressing GFP driven by the atoh7 promoter (green) and stained with DAPI (blue) and HuC/D antibody (red). moks309 retinas (H) have an increased number of GFP-expressing RGCs compared to wild-type (G). Scale bars, 500 μm (A and B) and 100 μm (C?H). |
|
moks309 Retinas Have Increased RGCs and Decreased Bipolar and Müller Glia Cells Due to Premature Neurogenesis (A?H) Horizontal 5 dpf retina sections. GFP expression under the control of atoh7 (A and E) and Brn3c (Pou4f3) (B and F) promoters reveals an increase in RGCs in moks309 (E and F) as compared to the wild-type (A and B), with some RGCs ectopically located outside the GCL (yellow arrowheads in [E] and [F]). The Müller glia marker GS (C and G) and the bipolar cell marker PKCα (D and H) show fewer immunoreactive cell bodies (yellow arrowheads) in moks309 (G and H) as compared to wild-type (C and D). (I?P) Horizontal 50 hpf retina sections stained for IdU (green, injected at 26 hpf), BrdU (red, injected at 38 hpf), and DAPI (blue). moks309 retinas (M?P) show more IdU-positive and BrdU-negative cells than wild-type, indicating that a larger number of progenitors had exited the cell cycle between 26 and 38 hpf. Scale bars, 100 μm. |
|
Cell Transplantation Analysis Reveals that mok Acts Cell Autonomously (A?D) Representative sections of 5 dpf chimeric retinas. The transplanted cells are clearly identified by the expression of H2A-GFP marker (green) in their nuclei. Cell transplantation shows that moks309 mutant clones in wild-type host retinas (B) have a higher propensity to generate neurons located in the GCL compared to control (A). Conversely, wild-type clones in moks309 host retinas preferentially generate INL neurons (C). moks309 mutant clones in moks309 host retinas are shown for comparison (D). Dashed lines indicate the outer limit of the GCL. Scale bars, 100 μm. (E) Quantification of the transplantation results showing the distribution of clones in the three retinal nuclear layers. ***p < 0.001; *p < 0.01. Error bar indicates SEM. |
|
Expression of Dnct1 and Its Function in INM (A) Western blotting of extracts from 4 dpf embryos shows that Dnct1 is undetectable in moks309. (B) Time course analysis of Dnct1 expression by western blot in wild-type zebrafish (numbers on top indicate hours after fertilization). (C and D) Whole-mount in situ hybridization shows dnct1 enriched in the head and eye region (C) and in the notochord (D). Scale bars, 100 μm. (E and F) Coronal sections of 2 dpf retinas stained for the mitotic marker PH3. In moks309 (F), a number of mitotic cells are sparsely located throughout the retina, while, in the wild-type (E), they are confined within 2?3 cell diameters from the ventricular surface. Dashed lines demarcate the apical (right) and basal (left) domains. Asterisks indicate mitotic cells residing in the developing lens. (G) Scatter plot of wild-type (gray triangles) and moks309 mutant (black squares) circles, showing the maximum basal distance of nuclei during INM from 30?48 hpf. (H) Histogram showing that these populations are statistically different (p = 0.001, Wilcoxon two-sample test). Error bar indicates SEM. |
|
A Gradient of Notch Signaling along the Apical-Basal Axis of the Developing Retina (A?C) Coronal sections of 26 hpf retinas showing mRNA expression levels of components of the Notch/Delta signaling pathway. In situ hybridization shows higher levels of notch1a close to the apical surface of the retina (A) and deltaB and deltaC close to the basal surface (B and C). (D) Optical section of a 33 hpf retina expressing her4:dRFP and H2A-GFP transgenes in a mosaic manner. (E and F) Coronal sections of 26 hpf retinas stained with anti-DeltaC antibody, showing punctate cytoplasmic staining distributed in the basal half of the tissue both in wild-type and moks309 retinas. (G and H) Coronal sections of 26 hpf retinas stained with anti-Dnct1 antibody, showing an enrichment at the apical surface in wild-type retinas (G), which is virtually absent in mutants (H). (I) Coronal section of 26 hpf retina; α-tubulin staining reveals the parallel orientation of microtubules to the apical-basal axis. (J?L) Sections of mouse retina. Activated Notch1 antibody labels a subset of nuclei at the apical surface (J). Anti-Dnct1 and anti-BBS4 antibodies show a cytoplasmic, punctated staining enriched at the apical surface. γ-tubulin staining (G, H, K, L) reveals the apical localization of the centrioles in retinal progenitors. In (D)?(L), DAPI (blue) stains the nuclei. In all panels, apical surface is on the left. Scale bars, 25 μm (A?I) and 50 μm (J?L). |
|
Atoh7 Loss of Function and Notch Activation Can Rescue Late Cell Fates in moks309 (A?D) Compared to wild-type (A), mok mutants (B) have an excess of RGCs and few bipolar cells, labeled by PKCα immunoreactivity. lak (atoh7) mutants fail to generate RGCs and overproduce bipolar neurons (C). lak/mok double mutants have rescued bipolar cell production. (E?H) Heat-shocked induction of an activated form of Notch receptor NICD at 32 hpf drives progenitors toward a Müller glia fate (GS positive) in both wild-type (G) and moks309 retinas (H). The presence of the transgenes (hsp:Gal4, UAS:NICD) has no effect on Müller glia differentiation in the absence of heat shock (E and F). Scale bars, 100 μm. |
|
Disruption of the Nuclear Anchor to Dynactin Phenocopies the moks309 Mutation (A and B) Expression of the Müller glia marker GS is reduced in the retina of larvae injected with a syne2a-MO (B) compared to control MO-injected larvae (A). Scale bars, 100 μm. (C and D) Representative examples of sections of 5 dpf retinas overexpressing a control vector (C) or a dominant-negative Syne2a (KASH, [D]) under the control of a heat-shock promoter. The cells that express the constructs are identified by the expression of GFP marker (green). Clones of cells that express the syne2a dominant-negative construct preferentially generate GCL neurons. Scale bars, 50 μm. (E) Quantification of the KASH overexpression results, showing the distribution of clones in the three retinal nuclear layers. *p < 0.01, **p < 0.005. Error bar indicates SEM. (F) A model of the mechanism that couples INM with graded Notch activation. |
|
moks309 Embryos Have Increased Apoptosis Localized in the Eye/Head Region |
|
atoh7 Expression Is Prolonged in moks309 Retinas |
|
moks309 Retinas Have Increased RGCs and Decreased Bipolar Cells |
|
moks309 Retinas Have Normal Number of Amacrine and Horizontal Cells |
|
Premature Cell-Cycle Exit in moks309 |
|
Phenocopy of moks309 Phenotype by Morpholino Knockdown of Dynactin-1 Function PHENOTYPE:
|
|
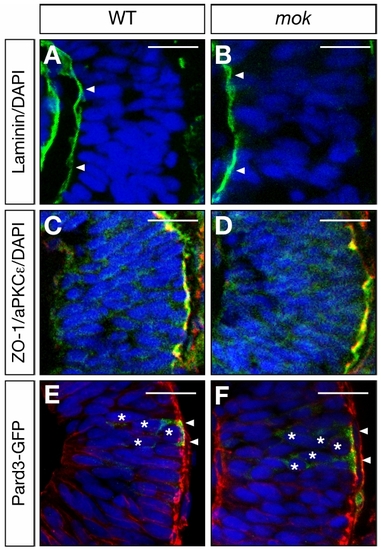
moks309 Mutants Have Normal Apical-Basal Marker Distribution |
|
Retinal Neuroepithelia Show Changes in Notch Activity with Nuclear Migration |
|
Decreased BBS4 Localization in moks309 Mutants |
|
Intact Localization of the Endocytic Compartment in dnct1Mo- Injected Embryos |
Reprinted from Cell, 134(6), Del Bene, F., Wehman, A.M., Link, B.A., and Baier, H., Regulation of neurogenesis by interkinetic nuclear migration through an apical-basal notch gradient, 1055-1065, Copyright (2008) with permission from Elsevier. Full text @ Cell


