- Title
-
The Wilms tumor genes wt1a and wt1b control different steps during formation of the zebrafish pronephros
- Authors
- Perner, B., Englert, C., and Bollig, F.
- Source
- Full text @ Dev. Biol.
|
Knockdown of wt1a and wt1b induces different phenotypes. (A) After injection of control, wt1a and wt1b morpholinos, RT-PCR analysis was performed from total RNA (10 pooled embryos from each injection). Both wt1a and wt1b primer pairs (indicated by arrows) are composed of a forward primer lying in the respective exon 1 and a reverse primer lying either in exon 2 (top panels) or in intron 1 (bottom panels). (B) Quantitative real-time RT-PCR was performed from total RNA of injected and pooled embryos at the indicated stage using primer pairs as described in panel A located in exon 1 and exon 2 of wt1a (upper panel) or wt1b (lower panel), respectively. All values were normalized to beta-actin. For comparison, expression in 1-day-old control embryos was set to 1. (C) Control, wt1a and wt1b morpholino-injected embryos are shown at different stages. Pericardial edema is marked by arrows and yolk sac edema by arrowheads; wt1a-MO, wt1a exon 1–intron 1 splice morpholino; wt1b-MO, wt1b exon 1–intron 1 splice morpholino; hpf, hours post-fertilization; dpf, days post-fertilization. |
|
Generation and characterization of a transgenic zebrafish line with pronephros-specific GFP expression. (A) Structure of the wt1b genomic region and the reporter construct. The upper panel shows the wt1b gene (9 exons) and the ga17 gene (11 exons) lying on chromosome 18. 5′ to 3′ orientation of both genes is indicated. Exons are represented by black boxes. The middle panel shows a restriction map of the region between ga17 and wt1b including the first exon of both genes. Untranslated regions are shown in light blue and coding regions in dark blue. Lower panel shows a schematic diagram of the construct used to generate transgenic fish. This construct contains an XhoI/ApaI genomic fragment fused to eGFP. (B, C) Overlays of transmission (gray) and fluorescence (green) dorsal images of 17 hpf (B) and 35 hpf (C) embryos, respectively. First four somites in panel B and first three somites in panel C are numbered and marked by parentheses; gl, glomerulus; pt, pronephric tubule; ep, exocrine pancreas. (D, E) Dorsolateral (D) and dorsal (E) fluorescence images of 35 hpf (D) and 65 hpf (E) embryos, respectively. The inset in panel D shows a bright-field image to illustrate the orientation of the embryo. Note that the image in panel D is overexposed with regard to the pronephros in order to display the weaker GFP expression in the eye, gill arches (ga) and the heart sac (hs). (F) A cross-section of a 65-hpf embryo through the middle of the yolk region is shown that has been hybridized with a ga17 riboprobe. EXPRESSION / LABELING:
|
|
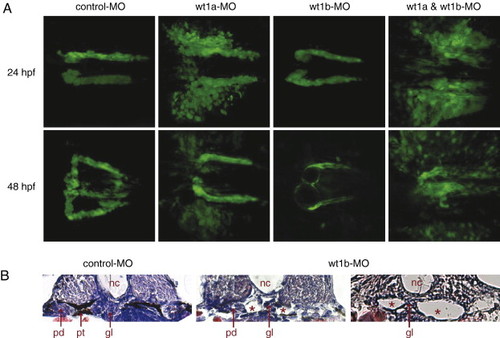
Knockdown of wt1a and wt1b leads to different defects during pronephros development. (A) Confocal images of control and wt1 morpholino-injected wt1b::GFP embryos were recorded 24 and 48 h after fertilization and assembled into 3D projections. (B) Formation of kidney cysts (asterisks) in wt1b morpholino-injected embryos 48 h after fertilization was visualized by H&E staining on cross sections. Note that a part of the glomerular filtration unit was still detectable between the cystic structures. nc, notochord; gl, glomerulus; pt, pronephric tubule; pd, pronephric duct. |
|
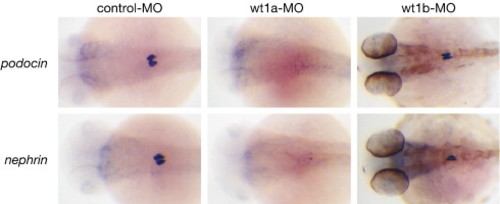
Differential loss of podocyte-specific marker genes in wt1a and wt1b morphant embryos. Control, wt1a and wt1b morpholino-injected embryos were collected at 48 hpf and whole mount in situ hybridization was performed using nephrin or podocin riboprobes. Pigmentation in eyes and trunk of wt1b morphants (right panel) is due to pigment cells that escaped PTU treatment. EXPRESSION / LABELING:
|
|
Additional wt1a and wt1b morpholinos serve as controls for specificity. Embryos injected either with control morpholino, a morpholino blocking translation of the wt1a mRNA (AUG) or a morpholino targeting the second splice donor site of the wt1b pre-mRNA (Splc2-2) are shown. Note that the phenotypes resemble closely those of embryos, which were injected with a morpholino targeting the first splice donor site of the respective gene (Fig. 1C). PHENOTYPE:
|
|
Co-injection of wt1a and wt1b morpholinos induces an additive phenotype. Embryos injected either with control morpholino or with morpholinos targeting the first splice donor site of wt1a or wt1b, respectively, are shown. In the right panel embryos, which were co-injected with both wt1a and wt1b morpholinos are displayed. These embryos share features of wt1a morphants, like severe yolk sac edema (arrowhead), and wt1b morphants, like body curvature (asterisk). |

Unillustrated author statements EXPRESSION / LABELING:
|
Reprinted from Developmental Biology, 309(1), Perner, B., Englert, C., and Bollig, F., The Wilms tumor genes wt1a and wt1b control different steps during formation of the zebrafish pronephros, 87-96, Copyright (2007) with permission from Elsevier. Full text @ Dev. Biol.


