- Title
-
The circadian system is a target and modulator of prenatal cocaine effects
- Authors
- Shang, E.H., and Zhdanova, I.V.
- Source
- Full text @ PLoS One
|
Prenatal exposure to cocaine alters neuronal development in α1-TGFP transgenic zebrafish embryos. Control embryos (A: 63 hpf; B and C: 37 hpf) show highly similar patterns of GFP reporter expression. Although major anatomical abnormalities were not found in cocaine-treated embryos, they display variable patterns and typically lower levels of GFP reporter expression (D?G) following repeated cocaine administration (1 μM, 15 min every hour for 5 daytime hours, starting at 22?24 hpf). (C) and (G) correspond to the dotted line areas in (B) and (F), respectively, and show GFP reporter expression in the spinal cord (sc) and enteric neurons (arrows). Note that a double string of enteric neurons, separated by a prospective lumen, is visible in both control embryos (c) but only in one of the cocaine-treated embryos (left in F and G). (D) and (E) depict different GFP expression patterns in the forebrain of four cocaine-treated embryos (37 hpf): lateral (D) and semi-dorsal view (e; arrowheads-eyes). All pictures are original photographs of live, responsive-to-touch embryos of the same clutch, placed next to each other on the cover glass. Black spots in (A) and (D) represent pigment. Out-of-focus areas on the close-up whole-embryo pictures (e.g., B, F) are due to the curved position of the embryo around the spherical yolk sack. The pictures are from one of the 12 clutches studied in LD, and are representative of 3 independent experiments. Scale bars: 250 μm. (H and I) Mean (SEM) percent change in fluorescence intensity in the brain and spinal cord of 37 hpf embryos raised in LD (H) or LL (I) conditions, relative to mean Control group intensity in LD (100%). Control (white bar), repeated cocaine (1 μM) administration alone (black bar) or with 30-min melatonin pre-treatment (diagonal bar) at 22 hpf. p<0.05 * relative to LD Control, or # relative to LL Control (one-way ANOVA), n = 28 per treatment group. |
|
Prenatal daytime cocaine exposure dose-dependently alters expression of genes involved in neurotransmission (A) circadian system (B, C) growth (D) and melatonin signaling (E), and these effects are counteracted by melatonin. (A?E) Melatonin (100 nM for 45 min), Low (0.3 μM) or High (30 μM) cocaine doses (15 min), with or without melatonin pre-treatment (100 nM, 30 min). (F) Melatonin receptor antagonist Luzindole attenuates the counteracting effects of melatonin on cocaine-induced changes in the expression of all six melatonin receptor genes; only one (zMel1a-1) receptor shown. Treatments: luzindole 50 µM for 20 min prior to melatonin; melatonin 100 nM for 20 min prior to cocaine; cocaine 0.3 µM for 15 min. (G) Dose-dependent effects of cocaine (20 min) on melatonin receptor expression. Y axis: fold change relative to control (=1). N=3?4 samples/treatment group, 25 embryos/sample. MeanħSEM, t-test (vs. control), * p<0.05, ** p<0.01, *** p<0.001; One way ANOVA (between treatments), a: p<0.05, vs. cocaine-only group. Mlt-melatonin; Coc-cocaine. EXPRESSION / LABELING:
|
|
Nighttime low- or high-dose cocaine exposure fails to alter the expression of zDAT, zBmal1, zGH and melatonin receptor genes during zebrafish development but continues to affect zPer3, and this effect is counteracted by melatonin. (A?E) Melatonin (100 nM for 45 min), Low (0.3 μM) or High (30 μM) cocaine doses (15 min), with or without melatonin pre-treatment (100 nM, 30 min) administered to 36-hpf embryos. N=3?4 samples/treatment group, 25 embryos per sample. MeanħSEM, t-test (vs. control), * p<0.05, ** p<0.01, *** p<0.001; One way ANOVA (between treatments), a: p<0.05, vs. cocaine-only group. Mlt-melatonin; Coc-cocaine. EXPRESSION / LABELING:
|
|
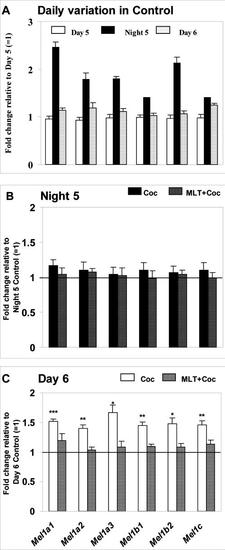
Daily variation in melatonin receptor expression, cocaine efficacy and ability of melatonin to counteract the effects of cocaine are preserved during early postnatal period in zebrafish. (A) Normal daily pattern of mRNA expression for six melatonin receptors on Day 5, Night 5 and Day 6 post-fertilization in Control group, fold change expressed relative to Day 5 (=1). (B) Change in melatonin receptor expression following Daytime cocaine administration alone (Coc) or following melatonin pre-treatment (MLT+Coc) at 6 dpf, relative to Daytime Control group (=1); (C) Change in melatonin receptor expression following Nighttime cocaine administration alone (Coc) or following melatonin pre-treatment (MLT+Coc) at 6 dpf, relative to Nighttime Control group (=1). Cocaine (0.3 μM, 20 min), melatonin pre-treatment (100 nM, 30 min prior to cocaine). Y axis: fold change relative to corresponding control (=1). N=3?4 samples/treatment group, 20 larvae per sample. MeanħSEM, t-test (vs. control), * p<0.05, ** p<0.01, *** p<0.001 vs. cocaine-only group; One way ANOVA. |
|
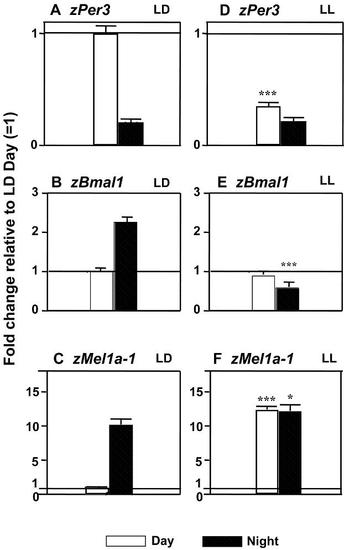
Normal diurnal variation in zPer3, zBmal1 and melatonin receptors is altered in embryos raised under constant light conditions. Daytime increase in zPer3 expression in LD (A) is partially preserved in LL (D; p<0.05). Daily variation in zBmal1 and zMel1a-1 (and other melatonin receptors) is abolished in LL (B vs. E; C vs. F). Y-axis in all plots: fold change relative to LD-Day level (=1). N=3?4 samples/time point in LD or LL group, 25 embryos/sample. MeanħSEM, t-test, * p<0.05, ** p<0.01, *** p<0.001 indicates difference between LD and LL, at Day or Night, accordingly. |
|
Constant light (LL) changes embryonic gene expression and magnitude of cocaine effects, while preserving circadian variation in cocaine and melatonin actions. Effects of melatonin, cocaine or their combination on gene expression display diurnal (circadian) variation in LL, similar to that in LD (Fig. 2), for both zPer-3 (A vs. B) or melatonin receptors (C vs. D). Treatment: Melatonin, 100 nM, 50 min or 20 min before cocaine. Cocaine: 30 μM, 20 min. Y-axis: fold change relative to corresponding, Day or Night, LL control (=1). N=3?4 samples/time point in LD or LL group, 25 embryos/sample. MeanħSEM, t-test (vs. control), * p<0.05, ** p<0.01, *** p<0.001; One way ANOVA (between treatments), a: p<0.05, vs. other two groups. |


