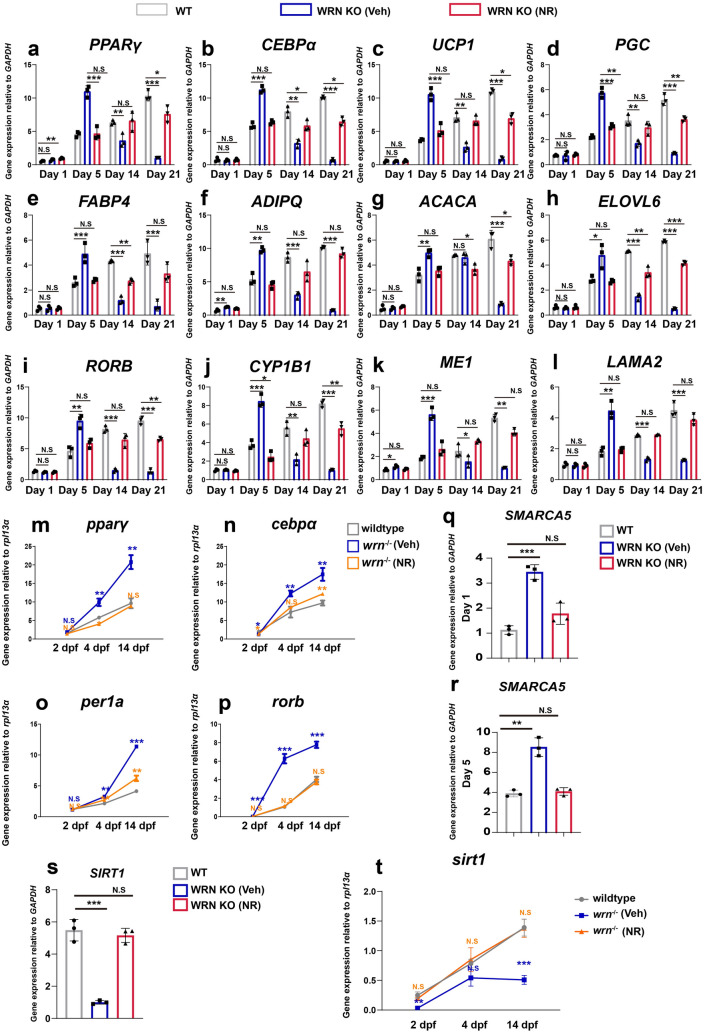
IMAGE

Fig. 8

ID
ZDB-IMAGE-240109-57
Genes
Source
Figures for Tian et al., 2024
Image
Figure Caption

Fig. 8

Nicotinamide riboside (NR) normalizes metabolism in WRN KO adipocytes. ah qTR-PCR analysis of selected adipogenic genes PPARγ (a), CEBPα (b), UCP1 (c), PGC (d), FABP4 (e), ADIPQ (f), ACACA (g), and ELOVL 6 (h) among WT, WRN KO (veh), and WRN KO (NR) in hMSCs (N = 3 biological replicates). il qTR-PCR analysis of selected adipogenic circadian genes RORB (i), CYP1B1 (j), ME1 (k), and LAMA2 (l) among WT, WRN KO (veh), and WRN KO (NR) (N = 3 biological replicates). mp qTR-PCR analysis of selected adipogenic circadian genes pparγ (m), cebpα (n), per1a (o), and rorb (p) among wildtype, wrn−/− mutant zebrafish (veh), and wrn−/− mutant zebrafish (NR) (N = 3 biological replicates). q, r qTR-PCR analysis of SMARCA5 on day 1 (q) and day 5 (r) during adipogenesis (N = 3 biological replicates). s qTR-PCR analysis of SIRT1 on day 5 during adipogenesis (N = 3 biological replicates). t qTR-PCR analysis of sirt1 at 2 dpf, 4 dpf, and 14 dpf in zebrafish (N = 3 biological replicates). Data are presented as the mean ± S.D. Statistical analysis was performed using two-tailed unpaired Student’s t-test. *P < 0.05, **P < 0.01, ***P < 0.001

Figure Data
Acknowledgments
This image is the copyrighted work of the attributed author or publisher, and ZFIN has permission only to display this image to its users. Additional permissions should be obtained from the applicable author or publisher of the image. Full text @ Cell Biosci.