Fig. 1
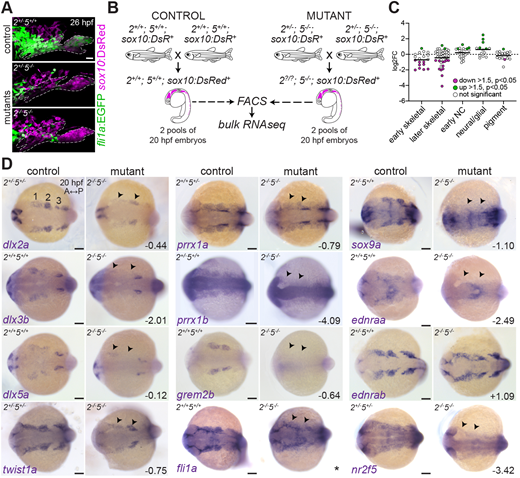
Fig. 1 Suppression of the ectomesenchyme program in nr2f2el/el;nr2f5el/el mutants. (A) nr2f5 single and nr2f2;nr2f5 double mutants show reduced fli1a:EGFP in the arches at 26 hpf. sox10:DsRed marks NC-derived cells; dashed lines indicate arch boundaries. (B) Breeding strategy for FACS and RNAseq of sox10:DsRed+ cells from control and nr2f5 mutant embryos. (C) DESeq2-generated log2-transformed fold-change values of genes enriched in distinct NC lineages between mutants and controls. Bars indicate the mean. (D) In situ hybridizations for ectomesenchyme genes in controls and double mutants at 20 hpf (dorsal views, anterior towards the left). Arrowheads indicate diminished expression. The three bilateral CNCC streams are marked in the top left image. Bottom right numbers are log2-transformed fold-change values from the RNAseq experiment. *The fli1a fold-change value is considered unreliable due to the fli1a:EGFP transgene being present in the mutant but not in the control sample. Scale bars: 20 Ám in A; 100 Ám in D.

