
Figure 3
|
Figure 3
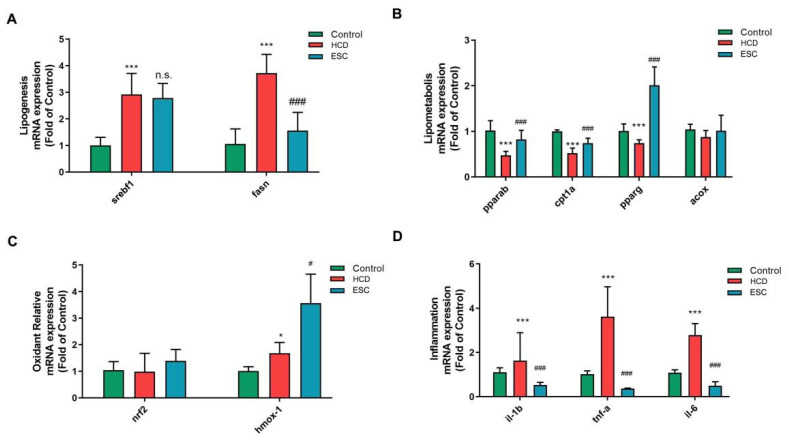
NAFLD-related mRNA expression changes in ESC on the HCD-induced Larval Zebrafish Model. (A) The gene expression level of lipogenesis on larval zebrafish. (B) The gene expression level of lipometabolism on larval zebrafish. (C) The gene expression level of oxidant stress on larval zebrafish. (D) The gene expression level of inflammation on larval zebrafish. Bar indicates means ± SD. * p < 0.05, *** p < 0.001 represent compared with the control; n.s. represents no significance; # p < 0.05, ### p < 0.001 represents compared with the model. p < 0.05 was considered as statistically significant calculated by One-way ANOVA followed by Tukey’s test (n = 3, indicates the replicates of the experiment).