
|
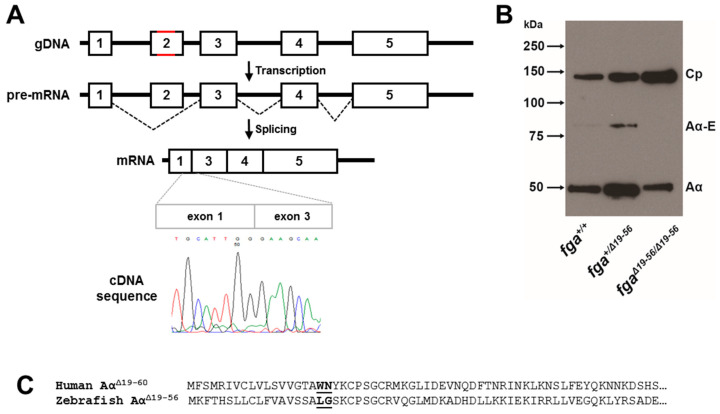
Figure 4 fga exon 2 skipping. (A) A scheme to highlight changes in fga exon 2 genomic DNA in red (gDNA) led to exon 2 skipping after transcription and splicing. A partial cDNA sequence to show the exon 1 to exon 3 splicing is shown. (B) Immunoblotting of plasma samples from fga+/+, fga+/?19?56, and fga?19?56/?19?56 fish with anti-ceruloplasmin and anti-fibrinogen A? chain antibodies. (C) Amino acid alignment of the predicted fibrinogen A? chains resulting from the human FGA IVS2+3insCAT mutation and the zebrafish fga?19?56 mRNA. The junction of exon 1- and exon 3-encoded amino acids are in bold and underlined for each chain.