
Fig. 6
- ID
- ZDB-FIG-241104-27
- Publication
- Lťgarť et al., 2024 - CHCHD10P80L knock-in zebrafish display a mild ALS-like phenotype
- Other Figures
- All Figure Page
- Back to All Figure Page
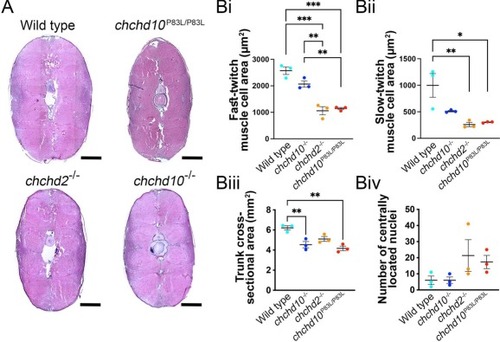
Muscle cells from 11-month old chchd2 ?/? and chchd10P83L/P83L zebrafish trunks possessed smaller fast-twitch and slow-twitch cross-sectional areas. A, Representative images of H&E-stained whole trunk cross-sections. Scale bar represents 100 ?m. Bi, Quantification of fast-twitch muscle cell cross-sectional area from chchd2 ?/? and chchd10P83L/P83L models showed smaller areas when compared to wild type and chchd10 ?/? cells (F (3, 8) = 36.01, p < 0.0001). Mean areas and number of Fast-twitch cells counted were as follows: wild type, 2574.2 ?m2 (N = 3, n = 208); chchd10 ?/?, 2068.0 ?m2 (N = 3, n = 192); chchd2 ?/?, 1059.4 ?m2 (N = 3, n = 240); chchd10P83L/P83L, 1141.0 ?m2 (N = 3, n = 173). Double asterisks (p < 0.01) and triple asterisks (p < 0.001) denote statistical significance. Bii, Quantification of slow-twitch muscle cell cross-sectional areas revealed that chchd2 ?/? and chchd10P83L/P83L models were smaller when compared to wild type cells (F (3, 8) = 8.87, p < 0.01). Mean area and number of slow-twitch cells counted are as following: wild type, 997.6 ?m2 (N = 3, n = 138) chchd10?/?, 511.1 ?m2 (N = 3, n = 136); chchd2 ?/?, 259.3 ?m2 (N = 3, n = 205); chchd10P83L/P83L, 302.4 ?m2 (N = 3, n = 144). Single asterisk (p < 0.05) and double asterisks (p < 0.01) denote statistical significance. Biii, Measure of whole trunk cross-sectional area was found to be smaller in chchd10?/? and chchd10P83L/P83L across our genetic groupings (F (3,8) = 12.58, p = 0.002), with the following mean areas: wild type, 6.21 mm2; chchd10 ?/?, 4.54 mm2; chchd2 ?/?, 5.11 mm2; chchd10 P83L/P83L, 4.17 mm2. Double asterisks (p < 0.01) represent statistical significance. No significant differences were found in our tabulation of centrally located nuclei across our genetic groupings (F (3, 8) = 1.973, p = 0.20, Biv). |