
Fig. 2
- ID
- ZDB-FIG-241104-23
- Publication
- Lťgarť et al., 2024 - CHCHD10P80L knock-in zebrafish display a mild ALS-like phenotype
- Other Figures
- All Figure Page
- Back to All Figure Page
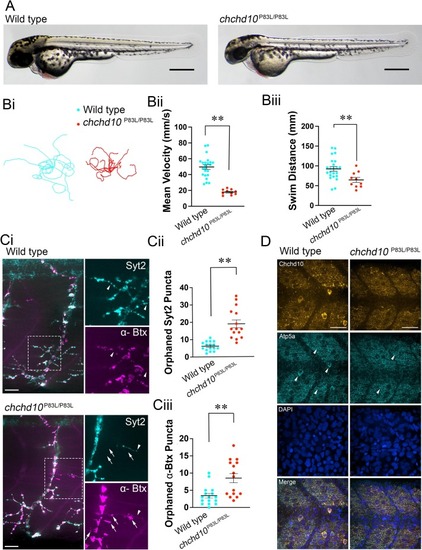
Homozygous chchd10P83L larvae display reduced touch response behaviour, orphaned NMJ pre- and post-synaptic markers and reduced survival. A, Representative images of 56 hpf larvae. Scale bars represent 400 ?m. Bi, Ten representative touch-evoked motor response traces superimposed on each other from wild type and chchd10P83L/P83L larvae aged 2 dpf. Bii, Chchd10P83L/P83L swam at a significantly lower mean velocity compared to wild type fish (t (31) = 6.05, p < 0.0001). Mean swim velocity and sample sizes are as follows: wild type (mean = 53.49 mm/s, n = 23), chchd10P83L/P83L (mean = 17.90 mm/s, n = 10). Biii, chchd10 P83L/P83L displayed significantly shorter mean distances compared to wild type larvae (t (31) = 2.84, p < 0.01). Mean swim distance and sample sizes were as follows: wild type (mean = 92.45 mm, n = 23), chchd10 P83L/P83L (mean = 64.66 mm, n = 10). Ci, Representative confocal images of ventral trunk NMJs in larvae aged 2 dpf. NMJ markers are Syt2 (pre-synaptic, cyan) and ?Btx (post-synaptic, magenta). Arrowheads and arrows represent orphaned Syt2 and ?Btx puncta, respectively. Scale bars represent 40 ?m. Cii, Quantification of orphaned pre-synaptic puncta. Larval chchd10 P83L/P83L displayed more orphaned pre-synaptic terminals devoid of post-synaptic labelling when compared to wild type NMJs (t (29) =5.594, p < 0.0001). Data are represented as mean Ī S.E.M. Ciii, Quantification of orphaned post-synaptic (?Btx) puncta. Larval chchd10P83L/P83L displayed increased orphaned AChR clusters lacking pre-synaptic Syt2 puncta when compared to wild type NMJs (U = 45.50, p < 0.01). Significance is represented by a double asterisk (p < 0.01). Sample sizes are as follows; wild type n = 16; chchd10P83L/P83L n = 15. D, Representative confocal images of the mitochondrial network in the superficially located slow-twitch muscle cell layer. Markers are Atp5a (mitochondria, cyan), DAPI (nuclei, blue), and Chchd10 (mitochondria, orange). Scale bars represent 70 ?m and arrowheads represent mitochondrial networks. (For interpretation of the references to colour in this figure legend, the reader is referred to the web version of this article.) |