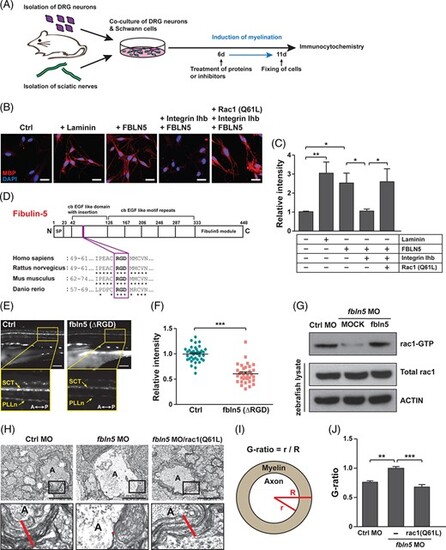
FBLN5 regulates myelination through RAC1 activation in Schwann cells. A, A schematic diagram of the induction of axonal myelination by the co-culturing of mouse primary DRG neurons and Schwann cells isolated from sciatic nerves. The cells were treated with proteins or inhibitors at 6 days after co-cultivation and fixed for immunostaining 5 days after the treatment. B, Images of mouse primary Schwann cells immunostained with anti-MBP antibodies after co-cultivation with primary DRG neurons under the indicated conditions. Laminin-treated Schwann cells were a positive control of myelination-induced cells. Scale bars, 20 ?m. C, Quantification of the relative intensities of MBP staining in the images of (B). Statistical significance was determined using one-way ANOVA followed by Tukey's post hoc test (*P < .05, **P < .005). D, A schematic diagram of the human FBLN5 protein structure identifying the RGD motif conserved in rat, mouse, and zebrafish fbln5 protein. E, Lateral view images of the Tg(claudin K:gal4-vp16;uas:egfp) zebrafish injected with MOCK or fbln5 (?RGD) mRNAs at 5 dpf. The images within the rectangles are magnified in the bottom panels. SCT, spinal cord tracts; PLLn, posterior lateral line; A, anterior; P, posterior. Scale bars, 100 ?m. F, Quantification of the relative intensity of PLLn in equivalent fields of view in the images of (E). The data are shown as the mean � SD of three independent experiments with ?20 embryos per condition. Statistical significance was determined using unpaired Student's t-test with Welch's correction (***P < .001). G, Results of pull-down assay for active rac1 in the indicated zebrafish tissues using PAK-PBP beads. Protein levels were normalized against ?-actin in the same blots. H, TEM images of cross-sectioned zebrafish of the indicated genotype at 5 dpf. The images within the rectangles are magnified in the bottom panels. The red lines indicate the thicknesses of the myelin sheaths in the Mauthner axons. A, axon. Scale bars, 2 ?m. I, A schematic diagram of how the G-ratio is obtained: the G-ratio is calculated by dividing the radius of the axon (r) by the total radius of the axon and myelin (R). J, Quantification of G-ratios calculated in the Mauthner axons of the indicated zebrafish. Statistical significance was determined using one-way ANOVA followed by Dunnett's post hoc test (**P < .005, ***P < .001). The data are shown as the mean � SD (C, F, J)
|
