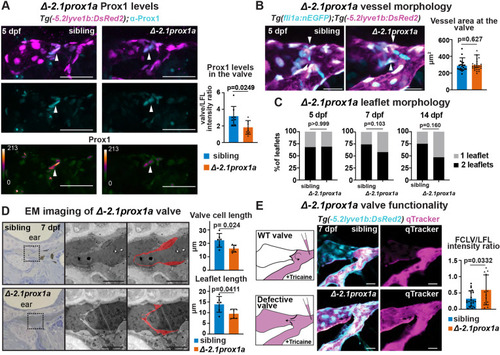
−2.1prox1a is necessary for correct valve development and function. (A) Top and middle: confocal projections of immunostaining against Prox1 (cyan) and Tg(−5.2lyve1b:DsRed2)nz101 (magenta) in sibling and Δ−2.1prox1a mutant embryos at 5 dpf. Bottom: heatmap visualisation of Prox1 protein levels in sibling and Δ−2.1prox1a mutant embryos. Left: quantification of Prox1 protein levels in the valves of 5 dpf embryos. Mean±s.d. Sibling (n=8) versus mutants (n=7). P=0.0249 (unpaired two-tailed Student's t-test). Three technical replicates, biological replicates correspond to the number of data points per condition. (B) Right: confocal projections of Tg(fli1:nEGFP)y7 (cyan) and Tg(−5.2lyve1b:DsRed2)nz101 (magenta) in sibling and Δ−2.1prox1a mutant embryos at 5 dpf. Left: quantification of vessel section at the valve (arrowheads) in Δ−2.1prox1a embryos at 5 dpf. Mean±s.d. Sibling (n=22) versus mutants (n=24). Not significant (ns) (P=0.627; two-tailed Mann–Whitney test). Three technical replicates, biological replicates correspond to the number of data points per condition. (C) Quantification of leaflet morphology in the valves of 5, 7 and 14 dpf sibling and Δ−2.1prox1a embryos. Mean±s.d. 5 dpf siblings (n=19) versus Δ−2.1prox1a (n=26), ns (P>0.999; Fisher's test). 7 dpf siblings (n=27) versus Δ−2.1prox1a (n=29), ns (P=0.103; Fisher's test). 14 dpf siblings (n=12) versus Δ−2.1prox1a (n=21), ns (P=0.160; Fisher's test). Three technical replicates, biological replicates correspond to the number of data points per condition. (D) Left: brightfield and TEM imaging of sibling (n=3) and Δ−2.1prox1a (n=3) valves at 7 dpf. The leaflets in the TEM images are highlighted in red. Right: quantification of cell length: mean±s.d. Siblings (n=6) versus Δ−2.1prox1a (n=6). P=0.024 (unpaired two-tailed Student's t-test). Quantification of leaflet length: mean±s.d. Siblings (n=6) versus Δ−2.1prox1a (n=6). P=0.0411 (unpaired two-tailed Student's t-test). Two technical replicates, biological replicates correspond to the number of data points per condition. (E) Left: schematic and confocal projections of Tg(−5.2lyve1b:DsRed2)nz101 (cyan) and Qtracker (magenta) in sibling and Δ−2.1prox1a mutant embryos at 7 dpf, visualising flow through the vessel. Right: quantification of Qtracker leakage through the valve in sibling and Δ−2.1prox1a embryos at 7 dpf. Mean±s.d. Siblings (n=21) versus mutants (n=12). P=0.0332 (unpaired two-tailed Student's t-test). Two technical replicates, biological replicates correspond to the number of data points per condition. Scale bars: 50 μm (A); 20 μm (B,E); 10 μm (D).
|
