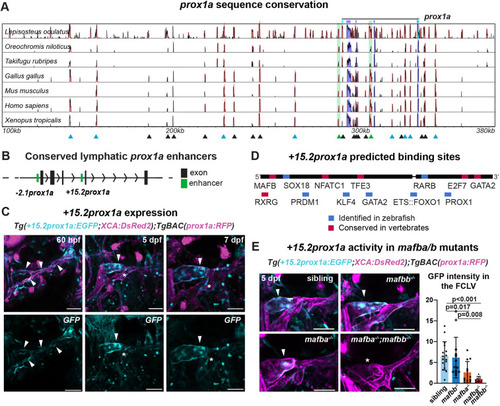
The conserved +15.2prox1a enhancer drives expression in a subset of the facial lymphatics. (A) Conservation analysis of the 380 kbp region surrounding the zebrafish prox1a locus compared with seven vertebrate species. Blue peaks, exons; red peaks, conserved non-coding DNA; black arrowheads, conserved peaks; blue arrowheads, tested peaks; green arrowheads, identified −2.1prox1a and +15.2prox1a lymphatic enhancers. In the 5′ the first 100 kbp of the alignment contain no conservation peak and has been omitted from the graph. (B) prox1a locus showing the position of the identified conserved lymphatic enhancers. Green boxes, −2.1prox1a and +15.2prox1a enhancers; black boxes, exons. (C) Confocal projections of facial lymphatics labelled with Tg(+15.2prox1a:EGFP; XCA:DsRed2)uu7kk (cyan) and Tg(prox1a:RFP)nim5 (magenta) at 60 hpf, 5 dpf and 7 dpf. Arrowheads show expression in the facial LECs (60 hpf) and FCLV (5 and 7 dpf). Asterisks show expression in facial lymphatic endothelium. (D) Predicted endothelial TF binding sites in +15.2prox1a. Blue, binding sites identified in zebrafish (P<1e-04); red, conserved binding sites within vertebrates. (E) Quantification of +15.2prox1a activity in mafba/b mutants. Left: confocal projections of facial lymphatics labelled with Tg(+15.2prox1a:EGFP; XCA:DsRed2)uu7kk (cyan) and Tg(prox1a:RFP)nim5 (magenta) at 5 dpf showing enhancer activity (arrowhead) or lack thereof (asterisk) in the FCLV. Right: quantification of signal intensity in the FCLV normalised to the ganglia in 5 dpf embryos. Sibling (n=16) versus mafbb−/− (n=13), mafba−/− (n=12) and mafba−/−;mafbb−/− (n=7). Mean±s.d. Sibling versus mafbb−/−, not significant (ns) (P>0.999); sibling versus mafba−/−, P=0.017; sibling versus mafba−/−;mafbb−/−, P<0.001; mafbb−/− versus mafba−/−, ns (P=0.146); mafbb−/− versus mafba−/−;mafbb−/−, P=0.008; mafba−/− versus mafba−/−;mafbb−/−, ns (P>0.999) (Kruskal–Wallis test with Dunn's multiple comparison test). Four technical replicates, biological replicates correspond to the number of data points per condition. Scale bars: 50 μm.
|