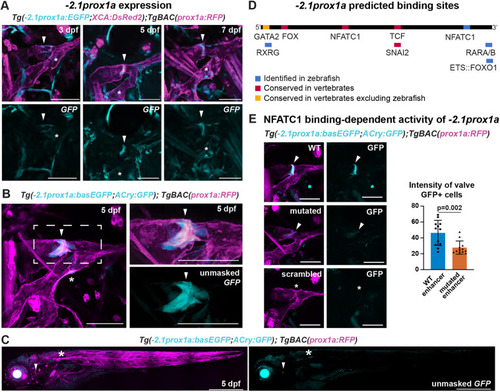
The conserved −2.1prox1a enhancer drives expression in the lymphatic valve. (A) Confocal projections of facial lymphatics labelled with Tg(−2.1prox1a:EGFP; XCA:DsRed2)uu3kk (cyan) and Tg(prox1a:RFP)nim5 (magenta) at 3, 5 and 7 dpf. Arrowheads show expression in the developing lymphatic valve. Asterisks show expression in the facial lymphatic endothelium. (B) Confocal projections of the facial lymphatics labelled with Tg(−2.1prox1a:basEGFP;ACry:GFP)uu10kk (cyan) and Tg(prox1a:RFP)nim5 (magenta) at 5 dpf. Left: expression in the lymphatic valve (arrowhead) and facial lymphatic endothelium (asterisk). Right: magnification of the boxed area in the left panel. (C) Confocal projection of the whole embryo at 5 dpf labelled with Tg(−2.1prox1a:basEGFP;ACry:GFP)uu10kk (cyan) and Tg(prox1a:RFP)nim5 (magenta). Arrowhead shows expression in the lymphatic valve. Asterisks show additional expression in the skin. (D) Predicted endothelial TF binding sites in −2.1prox1a. Blue, binding sites identified in zebrafish (P<1e-04); red, conserved binding sites within vertebrates; yellow, binding sites conserved in vertebrates but absent in zebrafish. (E) Representative images and quantification of Nfatc1 binding-dependent −2.1prox1a activity. Left: confocal projections of lymphatic valve labelled with WT, Nfatc1 binding site-mutated or scrambled −2.1prox1a:basEGFP;ACry:GFP constructs. Arrowheads show signal in the valve. Asterisk shows missing signal in the valve. Right: quantification of signal intensity in the valve cells expressing GFP in 5 dpf injected embryos. Mean±s.d. WT (n=12) versus Nfatc1 binding site-mutated (n=12) injected embryos at 5 dpf; P=0.002 (two-tailed Mann–Whitney test). Four technical replicates, biological replicates correspond to the number of data points per condition. Scale bars: 50μm (A,B,E); 500 μm (C).
|
