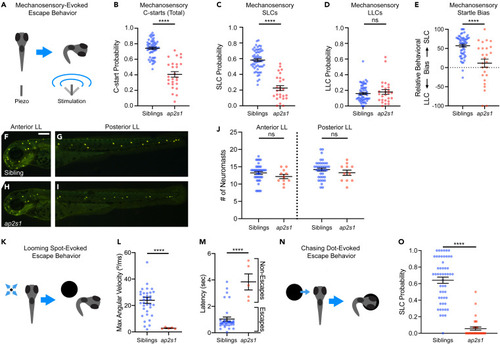
ap2s1 differentially regulates SLC and LLC escape behavior across varied stimulus modalities (A and B) C-start response probability of ap2s1p172 mutants (red, n = 26) to vibrating piezo stimuli compared to non-mutant siblings (blue, n = 56). ????p < 0.0001, two-tailed t-test with Welch?s correction. (C?E) Within the lateral line dependent mechanosensory-induced C-start responses, the probabilities of SLC responses (C) and LLC responses (D) for siblings (blue) and ap2s1p172 mutants (red), ????p < 0.0001, ns = not significant, two-tailed t-test with Welch?s correction. Relative behavioral bias of lateral line dependent mechanosensory-evoked escape behaviors (E) for siblings and ap2s1p172 mutants, ????p < 0.0001, two-tailed Mann-Whitney test. (F?J) Distribution of sensory neuromasts of the anterior lateral line (F, H) and posterior lateral line (G, I) labeled with FM1-43X in 3 dpf ap2s1p172 mutants (red, n = 11) compared to non-mutant siblings (blue, n = 38), ns = not significant, two-tailed Mann-Whitney test. Scale bar is 200?m. (K?M) Maximum angular velocity (L) and response latency (M) of individual behavioral responses of siblings (blue, n = 5) and ap2s1p172 mutants (red, n = 5) to looming visual stimuli. ????p < 0.0001, two-tailed Student?s t test with Welch?s correction. (N?O) Average SLC frequency of non-mutant siblings (blue, n = 53) and ap2s1p172 mutants (red, n = 33) in response to visual ?chasing dot stimuli.? ????p < 0.0001, two-tailed Mann-Whitney test. Data are represented as mean ± SEM in all panels.
|
