Fig. 4
- ID
- ZDB-FIG-240506-64
- Publication
- Lee et al., 2024 - Dysregulated lysosomal exocytosis drives protease-mediated cartilage pathogenesis in multiple lysosomal disorders
- Other Figures
- All Figure Page
- Back to All Figure Page
|
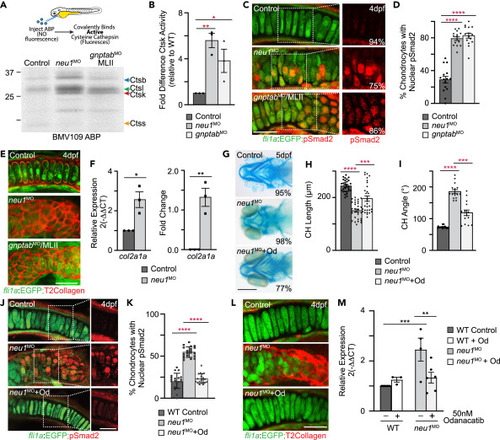
Increased cathepsin activity and altered TGF? signaling are associated with enhanced exocytosis (A) In gel analyses of embryos labeled with the BMV109 activity based probed show activity of several cysteine cathepsins is increased in both neu1 and gnptab deficient animals. (B) Graph shows Ctsk activity is increased in both genotypes relative to wild type. See Figure S3 for Ctsl and Ctsb. Error = SEM, significance was assessed Dunnet?s test (red stars), where ?p < 0.05, ??p < 0.01. (C) Confocal images of cartilage sections from fli1a:EGFP positive larvae immunohistochemically stained for pSmad2 (red) show TGF? signaling is increased in neu1 and gnptab deficient chondrocytes. Percent values represent number of embryos exhibiting the pictured phenotype. (D) Graph show percent of chondrocytes with nuclear pSmad2, indicative of transcriptional activity. (E) Confocal images of 4dpf fli1a:EGFP positive cartilage sections stained for type 2 collagen (red) show increased abundance in neu1 and gnptab deficient cells. (F) qRT-PCR analyses of col2a1 transcript abundance show it is increased in neu1 deficient animals. n = 3 biological replicates with samples of 10 larvae per genotype. SEM, significance was assessed using the Student?s t test where ?p < 0.05, ??p < 0.01. (G) Alcian blue stains of neu1 larvae treated with 50 nM odanacatib show inhibiting Ctsk improves phenotypes in 77% of embryos analyzed. Percent values represent number of animals exhibiting the pictured phenotype. n = 25?30 embryos per condition. (H and I) Graphs illustrate several parameters measured in odanacatib treated larvae. Error = SEM, significance was assessed using Dunnet?s test (red stars), where ???p < 0.001, and ????p < 0.0001. (J) Confocal analyses of pSmad2 stained fli1a:EGFP positive cartilage sections after odanacatib treatment show inhibiting Ctsk reduces activation of TGF? signaling. (K) Graph of the number of chondrocytes with nuclear pSmad2. n = ?20 larvae per condition. Error = SEM, significance was assessed using Dunnet?s test (red stars), where ????p < 0.0001. (L) Confocal images of sections from odanacatib treated animals stained for type 2 collagen. n = 25 larvae per condition from 2 to 3 biological replicates. (M) qRT-PCR of col2a1 transcript abundance in odanacatib treated animals. n = 3?5 biological replicates with 10 animals per sample per condition. All scale bars on confocal images: 10 ?m. Scale bar on Alcian blue: 20 ?m. Error = SEM, significance was assessed using the either the Student?s t test (black stars), where ??p < 0.01, ???p < 0.001. See also Figure S3. |

