- Title
-
Dysregulated lysosomal exocytosis drives protease-mediated cartilage pathogenesis in multiple lysosomal disorders
- Authors
- Lee, J.J., Wang, T., Wiggins, K., Lu, P.N., Underwood, C., Ochenkowska, K., Samarut, E., Pollard, L.M., Flanagan-Steet, H., Steet, R.
- Source
- Full text @ iScience
|
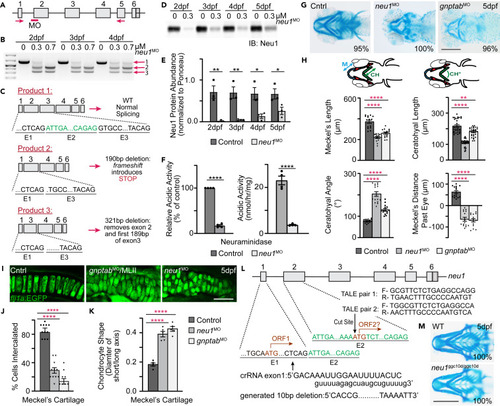
Loss of Neu1 disrupts development of craniofacial cartilage (A) Schematic of neu1 gene indicates position of the splice blocking morpholino (red bar, MO) and position of the primers used to amplify splice products. (B) RT-PCR of neu1 amplicons from 2 to 4 dpf showing the: (1) wild type product and (2 and 3) two alternate splice products resulting from morpholino inhibition. (C) Sequence analyses of gel isolated splice products show 2 novel transcripts resulting from the splice blocking morpholino, one of which introduces an in frame non-sense codon. (D and E) Western blot analyses show the morpholino significantly reduces Neu1 protein levels 2?5 dpf. n = 3 biological replicates with samples of 15 larvae per genotype. Error = SEM. Student?s t test, ?p < 0.05 ??p < 0.01. (F) Analyses of acidic neuraminidase levels in 5 dpf embryonic lysates show activity is reduced ?84%. n = 3 biological replicates with 15 larvae per sample per genotype. Error = SEM. Student?s t test, ????p < 0.0001. (G) Alcian blue stains of 5 dpf animals show loss of Neu1 disrupts craniofacial cartilage formation similar to loss of gnptab. Percent values indicate the number of scored embryos exhibiting pictured phenotype. Scale bar: 20 ?m. (H) Schematic indicate structures measured (M, Meckel?s cartilage length; CH, ceratohyal length; CH°, ceratohyal angle). Graphs compare measurements from wild type, neu1, and gnptab deficient animals. n = 15?20 embryos per genotype from 3 independent experiments. Error = SEM. Dunnet?s t test, ??p < 0.01, ????p < 0.0001. (I) Confocal images of gnptab and neu1 morphants show abnormal chondrocyte shape and organization. Scale bar: 10 ?m. (J) Quantitation of chondrocyte intercalation or stacking and (K) cell shape. Error = SEM. Dunnet?s t test, ????p < 0.0001. (L) Schematic illustrating two potential open reading frames (ORF), with ORF1 disrupted using the crisper guide shown and ORF1 and potential ORF2 both disrupted using two TALEN pairs shown. (M) Alcian blue stain of wild type and neu1ggc10d/ggc10d CRISPR generated mutant show eliminating ORF1 reduced size but causes minimal morphological alterations. Percent values indicate the number of scored animals exhibiting pictured phenotype (see also Figure S1). |
|
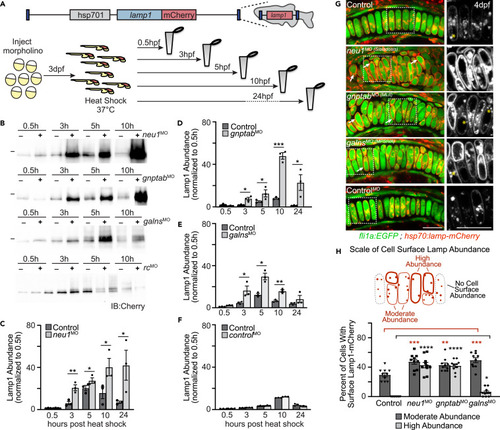
Lysosomal exocytosis is increased in cartilage of multiple models of lysosomal storage (A) Schematic of heat shock inducible Lamp1 protein and experimental procedure to assay Lamp1 abundance and subcellular localization. (B) Western blots probed for Lamp1 transgene in heat shocked animals suggest Lamp1 abundance is altered when neu1, gnptab, or galns expression is reduced, but not in those injected with a control morpholino (rc, random control). (C?F) Graphs quantitating the protein abundance of Lamp1-mCherry transgene in larvae harvested at various times post-heat shock. The level present at each time point is normalized to the amount of Lamp1 present 0.5 h post heat shock. n = 3 biological replicates of samples containing 10 larvae per genotype per time point. Error = SEM, Student?s t test ?p < 0.05, ??p < 0.01, ???p < 0.001. (G) Live confocal images of Lamp1-mCherry (red) in fli1a:EGFP (green) positive chondrocytes show increased cell surface abundance indicating increased exocytosis in neu1, gnptab, and galns deficient animals. Images performed 8?10 h post-heat shock. Boxed regions, yellow asterisks. Scale bar: 10 ?m. (H) The number of cells with high or moderate levels of Lamp1 (relative to total number of chondrocytes) was scored for each genotype. n = 10 larvae imaged and scored per genotype. See also Figure S2. Error = SEM, Student?s t test ???p < 0.001 or Dunnet?s t test ??p < 0.01, ???p < 0.001. |
|
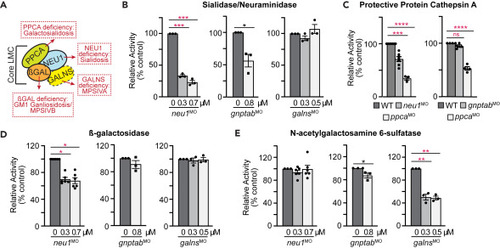
Enzymes in the lysosomal multienzyme complex (LMC) are differentially affected in the neu1, gnptab, and galns deficient larvae (A) Schematic of the LMC complex and the diseases each enzyme deficiency causes. (B) Acidic neuraminidase, (C) PPCA, (D) ?-galactosidase, and (E) N-acetylgalactosamine 6-sulfatase in neu1, gnptab, and galns deficient animals. n = 3 independent experiments with samples of 15 larvae per genotype. Error = SEM, significance was assessed using the Dunnet?s test, where ?p < 0.05, ??p < 0.01, ???p < 0.001, ????p < 0.0001. |
|
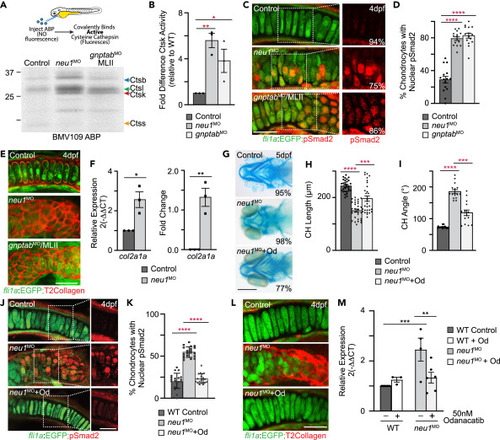
Increased cathepsin activity and altered TGF? signaling are associated with enhanced exocytosis (A) In gel analyses of embryos labeled with the BMV109 activity based probed show activity of several cysteine cathepsins is increased in both neu1 and gnptab deficient animals. (B) Graph shows Ctsk activity is increased in both genotypes relative to wild type. See Figure S3 for Ctsl and Ctsb. Error = SEM, significance was assessed Dunnet?s test (red stars), where ?p < 0.05, ??p < 0.01. (C) Confocal images of cartilage sections from fli1a:EGFP positive larvae immunohistochemically stained for pSmad2 (red) show TGF? signaling is increased in neu1 and gnptab deficient chondrocytes. Percent values represent number of embryos exhibiting the pictured phenotype. (D) Graph show percent of chondrocytes with nuclear pSmad2, indicative of transcriptional activity. (E) Confocal images of 4dpf fli1a:EGFP positive cartilage sections stained for type 2 collagen (red) show increased abundance in neu1 and gnptab deficient cells. (F) qRT-PCR analyses of col2a1 transcript abundance show it is increased in neu1 deficient animals. n = 3 biological replicates with samples of 10 larvae per genotype. SEM, significance was assessed using the Student?s t test where ?p < 0.05, ??p < 0.01. (G) Alcian blue stains of neu1 larvae treated with 50 nM odanacatib show inhibiting Ctsk improves phenotypes in 77% of embryos analyzed. Percent values represent number of animals exhibiting the pictured phenotype. n = 25?30 embryos per condition. (H and I) Graphs illustrate several parameters measured in odanacatib treated larvae. Error = SEM, significance was assessed using Dunnet?s test (red stars), where ???p < 0.001, and ????p < 0.0001. (J) Confocal analyses of pSmad2 stained fli1a:EGFP positive cartilage sections after odanacatib treatment show inhibiting Ctsk reduces activation of TGF? signaling. (K) Graph of the number of chondrocytes with nuclear pSmad2. n = ?20 larvae per condition. Error = SEM, significance was assessed using Dunnet?s test (red stars), where ????p < 0.0001. (L) Confocal images of sections from odanacatib treated animals stained for type 2 collagen. n = 25 larvae per condition from 2 to 3 biological replicates. (M) qRT-PCR of col2a1 transcript abundance in odanacatib treated animals. n = 3?5 biological replicates with 10 animals per sample per condition. All scale bars on confocal images: 10 ?m. Scale bar on Alcian blue: 20 ?m. Error = SEM, significance was assessed using the either the Student?s t test (black stars), where ??p < 0.01, ???p < 0.001. See also Figure S3. |
|
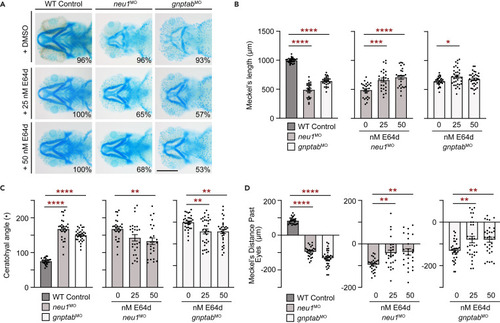
Treatment with the pan cathepsin inhibitor E64d rescues cartilage phenotypes in neu1 and gnptab deficient larvae (A) Alcian blue staining of larvae treated with either 25 nM or 50 nM E64d show inhibiting multiple cathepsin proteases substantially improves cartilage phenotypes in both neu1 and gnptab deficient animals. Percent values represent number of animals exhibiting the pictured phenotype. n = 25?30 larvae per condition from 3 independent experiments. Scale bar: 20 ?m. (B) Graphs of Meckel?s length in untreated (graph 1) or E64 treated neu1 (graph 2) or gnptab (graph 3) deficient embryos. (C) Graphs of ceratohyal angle, and (D) Meckel?s distance past the eyes. n = 25?30 embryos per condition from 3 independent experiments. In all cases error = SEM and significance was assessed using the Dunnet?s test (red stars), where ?p < 0.05, ??p < 0.01, ???p < 0.001, and ????p < 0.0001. |
|
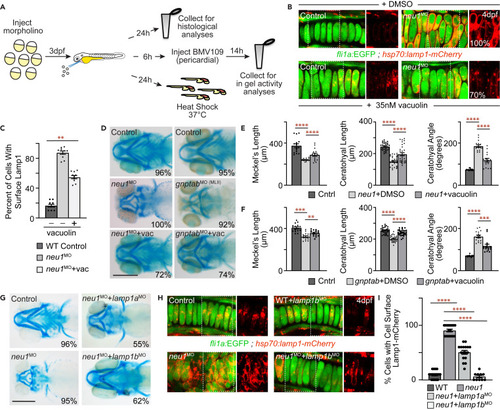
Inhibiting exocytosis improves cartilage phenotypes in neu1 and gnptab deficient larvae (A) Schematic illustrates experimental workflow including histological stains, BMV109 labeling and analyses of heat shock induced Lamp1-mCherry transgene. (B) Live confocal analyses of Lamp1-mCherry (red) location in fli1a:EGFP positive neu1 deficient cartilages treated with either DMSO or 35 nM vacuolin. Boxed areas shown in red only in panels to the right. Percent values represent number of animals exhibiting the pictured phenotype. n = 10 larvae per condition. (C) Graph shows the percent of cells with cell surface localized Lamp1 in each condition. See Figure S4 for additional quantitation. Error = SEM, significance was assessed using an ANOVA, where ??p < 0.01. (D) Alcian blue stained larvae show vacuolin treatment improves cartilage morphology in both neu1 and gnptab deficient animals. Percent values represent number of animals exhibiting the pictured phenotype. Scale bar: 20 ?m. (E and F) Cartilage measurements in neu1 (E) and gnptab (F) morphants treated with either DMSO or vacuolin. n = 10?20 larvae per condition from 3 independent experiments. Error = SEM, significance was assessed using the Dunnet?s test (red stars), where ???p < 0.001 and ????p < 0.0001. (G) Alcian blue stained control and neu1 morphant larvae co-injected with lamp1a or lamp1b morpholinos show Lamp1 modulation improves phenotypes (see also Figure S4). Percent values represent number of embryos exhibiting the pictured phenotype. n = 10 larvae per condition. Scale bar: 20 ?m. (H) Live confocal images of Lamp1-mCherry (red) in fli1a:EGFP (green) positive chondrocytes suggest Lamp1 modulation reduces cell surface lysosomal localization in neu1 morphants. (I) Quantitation of chondrocytes exhibiting cell surface localization. n = 15 larvae per condition. Error = SEM, significance was assessed using an ANOVA or the Dunnet?s test (red stars), where ????p < 0.0001. |
|
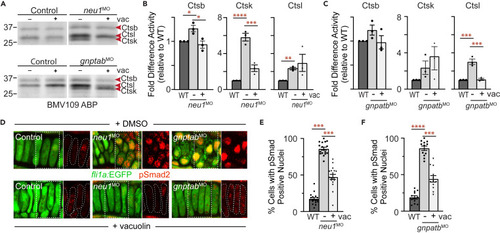
Vacuolin-mediated inhibition of exocytosis normalizes cathepsin activity and restored TGFß signaling in neu1 and gnptab deficient larvae (A) In gel analyses of embryos labeled with the BMV109 activity-based probe show vacuolin treatment primarily reduces Ctsk activity in neu1 deficient animals and Ctsl in gnptab deficient animals. n = 3 independent experiments with 12 embryos per condition. (B) Graph shows quantitation of Ctsk and Ctsl activities in neu1 deficient animals. Error = SEM, significance was assessed using the Dunnet?s test (red stars), where ?p < 0.05, ??p < 0.01, ???p < 0.001, and ????p < 0.0001. (C) Graph shows quantitation of Ctsk and Ctsl activities in gnptab deficient embryos. Error = SEM, significance was assessed using the Dunnet?s test (red stars), where ???p < 0.001. (D) Confocal analyses of pSmad2 staining in fli1a:EGFP positive neu1 and gnptab deficient cartilages treated with either DMSO or 35 nM vacuolin. Boxed areas shown as red only in panels to the right. For reference chondrocytes are outlined with dashed white lines. Percent values represent number of embryos exhibiting the pictured phenotype. n = 15 embryos per condition. (E and F) Graphs quantitating the percent of chondrocytes in neu1 or gnptab deficient larvae with nuclear localized pSmad2. Error = SEM, significance was assessed using the Dunnet?s test (red stars), where ?p < 0.05, ??p < 0.01, ???p < 0.001, and ????p < 0.0001. See also Figure S4. |

