Fig. 1
- ID
- ZDB-FIG-240506-61
- Publication
- Lee et al., 2024 - Dysregulated lysosomal exocytosis drives protease-mediated cartilage pathogenesis in multiple lysosomal disorders
- Other Figures
- All Figure Page
- Back to All Figure Page
|
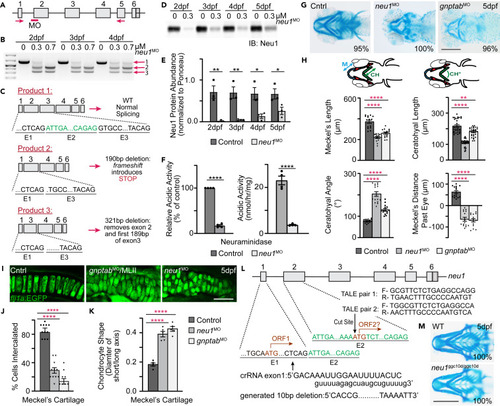
Loss of Neu1 disrupts development of craniofacial cartilage (A) Schematic of neu1 gene indicates position of the splice blocking morpholino (red bar, MO) and position of the primers used to amplify splice products. (B) RT-PCR of neu1 amplicons from 2 to 4 dpf showing the: (1) wild type product and (2 and 3) two alternate splice products resulting from morpholino inhibition. (C) Sequence analyses of gel isolated splice products show 2 novel transcripts resulting from the splice blocking morpholino, one of which introduces an in frame non-sense codon. (D and E) Western blot analyses show the morpholino significantly reduces Neu1 protein levels 2?5 dpf. n = 3 biological replicates with samples of 15 larvae per genotype. Error = SEM. Student?s t test, ?p < 0.05 ??p < 0.01. (F) Analyses of acidic neuraminidase levels in 5 dpf embryonic lysates show activity is reduced ?84%. n = 3 biological replicates with 15 larvae per sample per genotype. Error = SEM. Student?s t test, ????p < 0.0001. (G) Alcian blue stains of 5 dpf animals show loss of Neu1 disrupts craniofacial cartilage formation similar to loss of gnptab. Percent values indicate the number of scored embryos exhibiting pictured phenotype. Scale bar: 20 ?m. (H) Schematic indicate structures measured (M, Meckel?s cartilage length; CH, ceratohyal length; CH°, ceratohyal angle). Graphs compare measurements from wild type, neu1, and gnptab deficient animals. n = 15?20 embryos per genotype from 3 independent experiments. Error = SEM. Dunnet?s t test, ??p < 0.01, ????p < 0.0001. (I) Confocal images of gnptab and neu1 morphants show abnormal chondrocyte shape and organization. Scale bar: 10 ?m. (J) Quantitation of chondrocyte intercalation or stacking and (K) cell shape. Error = SEM. Dunnet?s t test, ????p < 0.0001. (L) Schematic illustrating two potential open reading frames (ORF), with ORF1 disrupted using the crisper guide shown and ORF1 and potential ORF2 both disrupted using two TALEN pairs shown. (M) Alcian blue stain of wild type and neu1ggc10d/ggc10d CRISPR generated mutant show eliminating ORF1 reduced size but causes minimal morphological alterations. Percent values indicate the number of scored animals exhibiting pictured phenotype (see also Figure S1). |

