|
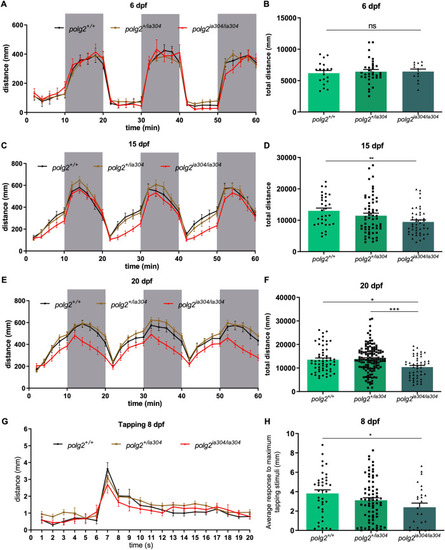
polg2ia304 behavioural defects assessed by locomotor analysis. A, C, E Effect of light stimuli on locomotion in polg2ia304/ia304 mutants at 6, 15 and 20 dpf, respectively. White fields indicate light exposition time, while grey fields represent dark periods. The analysis assessed the average total distance swum at 6 dpf (B), 15 dpf (D) and 20 dpf (F). Values derived from 3 independent biological replicates and are reported as mean ± SEM. Data were analysed using ordinary one-way ANOVA and Tukey’s test (B) or Kruskal-Wallis together with Dunn’s multiple comparison test (D, F); *p < 0.05; **p < 0.005; ***p < 0.001; for 6 dpf polg2+/+ (n = 19), polg2+/ia304 (n = 33), polg2ia304/ia304 (n = 13); for 15 dpf polg2+/+ (n = 32), polg2+/ia304 (n = 58), polg2ia304/ia304 (n = 45); for 20 dpf polg2+/+ (n = 57), polg2+/ia304 (n = 131), polg2ia304/ia304 (n = 49). G Effect of tapping stimulus on locomotion in wt, heterozygous and polg2ia304/ia304 individuals at 8 dpf. Tapping stimuli were delivered in a 20-s time window with an interstimulus interval of 1 s. H Average response to maximum tapping stimuli given as the total distance covered by polg2ia304/ia304 homozygotes during tap stress assay, compared to wt and heterozygous sibs. Results are expressed as mean ± SEM. For statistical analysis, the Kruskal-Wallis test corrected with Dunn’s multiple comparison test was applied; *p < 0.05; polg2+/+ (n = 38), polg2+/ia304 (n = 72), polg2ia304/ia304 (n = 26), from 3 independent experiments.
|