IMAGE

Fig. 2

ID
ZDB-IMAGE-240422-43
Source
Figures for Brañas Casas et al., 2024
Image
Figure Caption

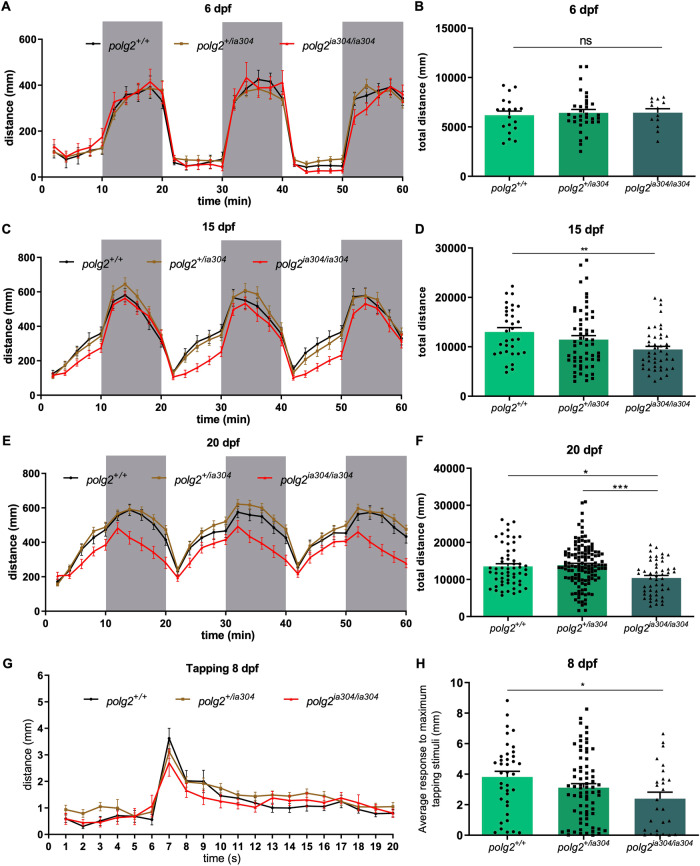
Fig. 2 polg2ia304 behavioural defects assessed by locomotor analysis.

A, C, E Effect of light stimuli on locomotion in polg2ia304/ia304 mutants at 6, 15 and 20 dpf, respectively. White fields indicate light exposition time, while grey fields represent dark periods. The analysis assessed the average total distance swum at 6 dpf (B), 15 dpf (D) and 20 dpf (F). Values derived from 3 independent biological replicates and are reported as mean ± SEM. Data were analysed using ordinary one-way ANOVA and Tukey’s test (B) or Kruskal-Wallis together with Dunn’s multiple comparison test (D, F); *p < 0.05; **p < 0.005; ***p < 0.001; for 6 dpf polg2+/+ (n = 19), polg2+/ia304 (n = 33), polg2ia304/ia304 (n = 13); for 15 dpf polg2+/+ (n = 32), polg2+/ia304 (n = 58), polg2ia304/ia304 (n = 45); for 20 dpf polg2+/+ (n = 57), polg2+/ia304 (n = 131), polg2ia304/ia304 (n = 49). G Effect of tapping stimulus on locomotion in wt, heterozygous and polg2ia304/ia304 individuals at 8 dpf. Tapping stimuli were delivered in a 20-s time window with an interstimulus interval of 1 s. H Average response to maximum tapping stimuli given as the total distance covered by polg2ia304/ia304 homozygotes during tap stress assay, compared to wt and heterozygous sibs. Results are expressed as mean ± SEM. For statistical analysis, the Kruskal-Wallis test corrected with Dunn’s multiple comparison test was applied; *p < 0.05; polg2+/+ (n = 38), polg2+/ia304 (n = 72), polg2ia304/ia304 (n = 26), from 3 independent experiments.

Acknowledgments
This image is the copyrighted work of the attributed author or publisher, and ZFIN has permission only to display this image to its users. Additional permissions should be obtained from the applicable author or publisher of the image. Full text @ Cell Death Dis.