FIGURE

Figure 2

ID
ZDB-FIG-240415-124
Publication
Portolés et al., 2024 - Identification of Dhx15 as a Major Regulator of Liver Development, Regeneration, and Tumor Growth in Zebrafish and Mice
Other Figures
All Figure Page
Back to All Figure Page
Figure 2

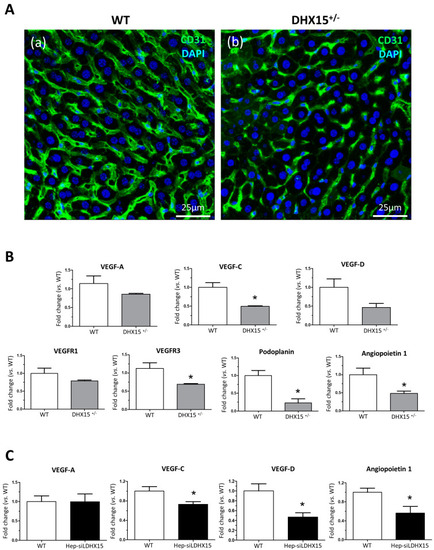
Intrahepatic liver vasculature was altered in Dhx15+/− mice. (A) Representative Cd31 liver immunostaining (green) for wild-type (panel a) and Dhx15+/− (panel b) mouse. Nuclei counterstaining was performed with DAPI (blue). Confocal microscope, original magnification: 300×. (B) RNA extraction of liver tissue from either wild-type or Dhx15+/− mice was performed. mRNA expression was analyzed by RT-qPCR. The graphs show the expression levels of Vegf-a, Vegf-c, Vegf-d, Vegfr1, Vegfr3, Podoplanin, and Angiopoietin 1 genes in the wild-type and Dhx15+/− conditions. mRNA levels are shown as fold change relative to Hprt mRNA levels. Bars represent mean ± SEM, * p < 0.05 vs. wild-type (n = 4). (C) RNA extraction of the hepatocyte cell line without or with silenced Dhx15 gene was performed. mRNA expression was analyzed by RT-qPCR. The graphs show the expression levels of Vegf-a, Vegf-c, Vegf-d, and Angiopoietin 1 genes in wild-type and Dhx15 silenced conditions. mRNA levels are shown as fold change relative to Hprt mRNA levels. Bars represent mean ± SEM, * p < 0.05 vs. wild-type (n = 4).

Expression Data

Expression Detail
Antibody Labeling
Phenotype Data

Phenotype Detail
Acknowledgments
This image is the copyrighted work of the attributed author or publisher, and ZFIN has permission only to display this image to its users. Additional permissions should be obtained from the applicable author or publisher of the image. Full text @ Int. J. Mol. Sci.