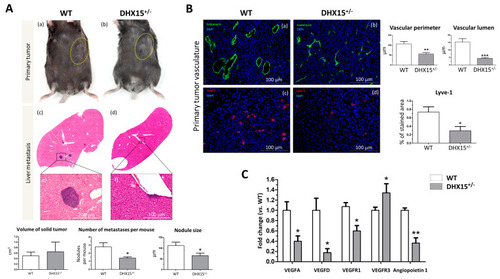
Tumor growth and metastases in Dhx15+/− mice following Hepa1-6 tumor induction. (A) In the upper panels, macroscopic images of tumor size in wild-type (panel a) and Dhx15+/− mice (panel b) 5 weeks after mouse Hepa1-6 hepatoma cells implantation. Yellow circles delimitate primary tumor localization. On the lower panels, representative liver sections with metastatic areas after haematoxylin–eosin staining (H&E) in wild-type (panel c) and Dhx15+/− mice (panel d). Original magnification: ×10. The lower images of each condition correspond to the enclosed area of the upper images that were taken at higher magnifications (×100 and ×200, respectively). Quantifications of tumor volume (cm3), number of metastases, and nodule size are shown in the lower graphs. Bars represent mean ± SEM, * p < 0.05 vs. wild-type mice (n = 10 animals for each condition). (B) Immunostaining of intratumoral vessels in wild-type (blood vessels stained with endomucin, panel a, and lymphatic vessels stained with Lyve-1, panel c) and Dhx15+/− (blood vessels stained with endomucin, panel b, and lymphatic vessels stained with Lyve-1, panel d) mice. Quantification of total vascular perimeter and lumen of all intratumoral blood vessels and percentage of Lyve-1-positive immunostaining are shown in the right graphs. Bars represent mean ± SEM, * p < 0.05, ** p < 0.01, *** p < 0.001 vs. wild-type mice (n = 10 animals for each condition). Original magnification: 200×. (C) RNA extraction of primary tumors from either wild-type or Dhx15+/− mice was performed. mRNA expression was analyzed by RT-qPCR. The graph shows the expression levels of Vegf-a, Vegf-d, Vegfr1, Vegfr3, and Angiopoietin 1 genes in wild-type and Dhx15+/− conditions. mRNA levels are shown as fold change relative to Hprt mRNA levels. Bars represent mean ± SEM, * p < 0.05, ** p < 0.01 vs. wild-type (n = 4).
|
