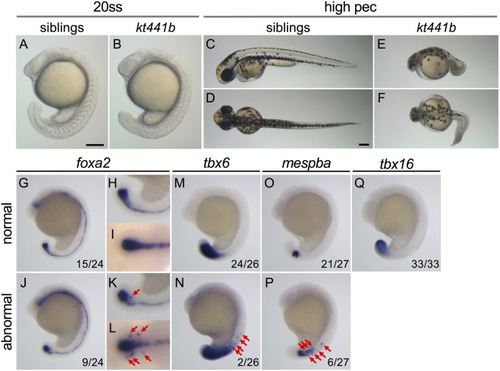
Phenotypes of kt441b homozygotes. (A–F) Morphology of siblings (A, C, D) and kt441b homozygous embryos (B, E, F) at the 20-somite stage; (A, B) and the high-pec stage (C–F). Side views (A, B, C, E) and dorsal views (D, F) are indicated. Stages were estimated by morphology according to the developmental stages of zebrafish defined by Kimmel (Kimmel C. B. (1995)). Estimated high-pec embryos had been grown at 24°C for 3 days. (G–Q) Expression patterns of foxa2(G–L), tbx6(M, N), mespba(O, P), and tbx16(Q) in embryos at the 19-somite stage generated by crossing between kt441b heterozygous male and female fish. Embryos showing normal gene expression patterns (G–I, M, O, Q) and abnormal ones are shown (J–L, N, P). Side (G, H, J, K, M–Q) and dorsal (I, L) views are indicated. For foxa2 expression, magnified images in the tailbud region are also shown (H, I, K, L). In side-view images, anterior sides are located at the top. In embryos exhibiting abnormal gene expression, foxa2, tbx6, and mespba were additively expressed beside regions where these genes are expressed in normal embryos (red arrows). Embryos stained with foxa2, tbx6, and mespba probes were genotyped, and it was confirmed that penetrance of abnormal gene expression in kt441b homozygous embryos was 100%. Scale bars, 200 μm.
|
