FIGURE SUMMARY
Title

Deficiency of mastl, a mitotic regulator, results in cell detachment from developing tissues of zebrafish embryos

Authors
Utsumi, H., Yabe, T., Koshida, S., Yamashita, A., Takada, S.
Source
Full text @ Front Cell Dev Biol

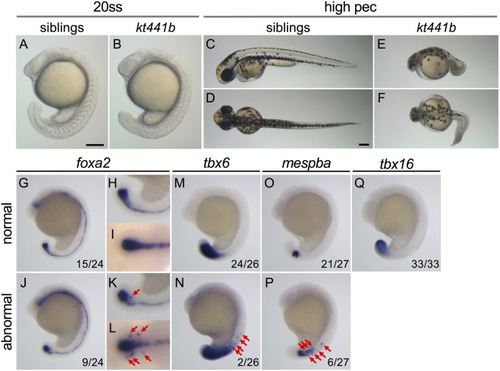
Phenotypes of kt441b homozygotes. (A–F) Morphology of siblings (A, C, D) and kt441b homozygous embryos (B, E, F) at the 20-somite stage; (A, B) and the high-pec stage (C–F). Side views (A, B, C, E) and dorsal views (D, F) are indicated. Stages were estimated by morphology according to the developmental stages of zebrafish defined by Kimmel (Kimmel C. B. (1995)). Estimated high-pec embryos had been grown at 24°C for 3 days. (G–Q) Expression patterns of foxa2(G–L), tbx6(M, N), mespba(O, P), and tbx16(Q) in embryos at the 19-somite stage generated by crossing between kt441b heterozygous male and female fish. Embryos showing normal gene expression patterns (G–I, M, O, Q) and abnormal ones are shown (J–L, N, P). Side (G, H, J, K, M–Q) and dorsal (I, L) views are indicated. For foxa2 expression, magnified images in the tailbud region are also shown (H, I, K, L). In side-view images, anterior sides are located at the top. In embryos exhibiting abnormal gene expression, foxa2, tbx6, and mespba were additively expressed beside regions where these genes are expressed in normal embryos (red arrows). Embryos stained with foxa2, tbx6, and mespba probes were genotyped, and it was confirmed that penetrance of abnormal gene expression in kt441b homozygous embryos was 100%. Scale bars, 200 μm.

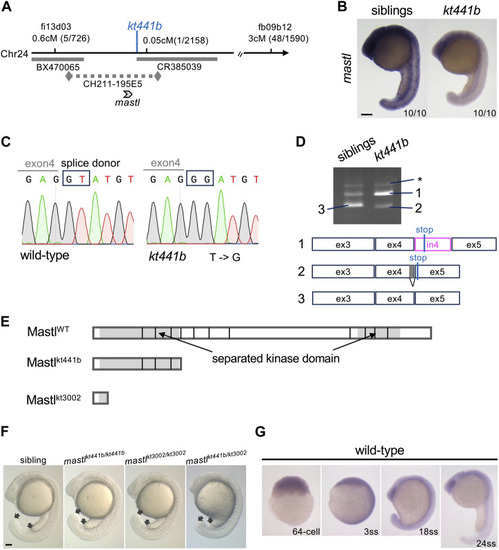
Identification of mastl as the gene responsible for the kt441b mutation. (A) A summary of genetic mapping of kt441b on chromosome 24. Numbers of recombinants and calculated distances for microsatellite markers are indicated. Gray bars indicate BAC clones, and a dotted line indicates a contig. (B)In situ hybridization showing expression of mastl in siblings and kt441b homozygous embryos at the 24-somite stage. For each, 10 embryos identified by their morphology, were stained at the same time. (C) Comparison of genomic sequences around a mutated nucleotide with the corresponding sequence of the wild-type allele. In kt441b mutation, a nucleotide in the splice donor site at the 3′ end of exon 4 of zebrafish mastl is changed from T to G. (D) PCR products of mastl cDNA prepared from 50 embryos of siblings and kt441b homozygous mutant embryos. cDNA was amplified with primers based on exons 3 and 5 of zebrafish mastl. Each PCR fragment from kt441b homozygotes was cloned and sequenced. The size of PCR fragment #3 is matched to the predicted one with proper splicing. Bands indicated with asterisks appear due to contamination of genomic DNA because they contain entire introns 3 and 4 in addition to exons 3,4 and 5 of zebrafish mastl. Note that siblings were a mixture of wild-type and heterozygote embryos. ex: exon, in: intron. (E) Schematic representation of zebrafish Mastl proteins with positions corresponding to exon-intron boundaries. Gray regions indicate the kinase domain, which is separated by a non-conserved region. One CRISPR mutant allele mastlkt3002 in which 11 bp are deleted in the mastl gene caused frameshifts upstream of the conserved kinase domain (Supplementary Figure S1). (F) Morphologies of mastlkt3002 homozygotes in comparison with mastlkt441b homozygotes. mastlkt3002 homozygous mutants exhibited similar morphology to mastlkt441b homozygotes and did not complement mastlkt441b. Arrows indicate the end of the yolk tube and the tip of the tailbud. (G) Expression of mastl mRNA at different stages of wild-type embryos. Expression of mastl mRNA was detectable even at the 64-cell stage, indicating that it is maternally expressed. Also, mastl mRNA was ubiquitously expressed from the 64-cell stage to the 24-somite stage. Scale bars, 100 μm.

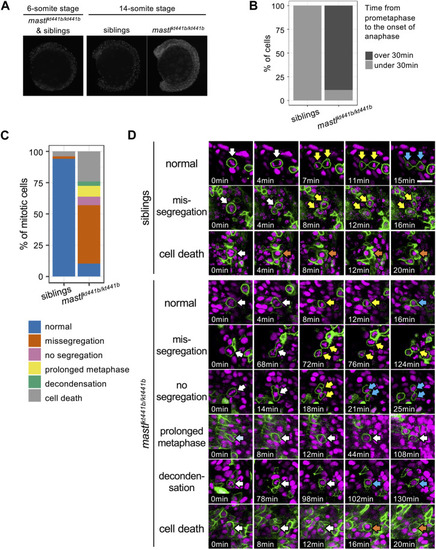
mastlkt441b homozygotes exhibit mitotic defects. (A) Phosphorylation of Histone H3 Ser10 (pHH3) in whole-mount embryos at the 6-somite stage (ss) and the 14 ss. At the 6 ss, no difference in phosphorylation was detectable among embryos containing siblings and mastlkt441b homozygotes. At the 14 ss, the number of pHH3-positive cells was increased in mastlkt441b homozygous embryos. For 14 ss embryos, 10 embryos of each phenotype were genotyped. (B) Time from prometaphase to the onset of anaphase of CNH cells. The duration was measured by time-lapse imaging of CNH cells with labeling of nuclei using Histone H2A-mChrery. The percentage of cells in which the duration of this process exceeded 30 min is indicated in dark gray. siblings: n = 10, mastlkt441b homozygotes: n = 18. (C) Classification of abnormalities of mitotic cells in the tail bud of siblings and mastlkt441b homozygous embryos. Embryos were labeled with Histone H2A-mCherry and sparsely labeled with membrane-Venus. All membrane-Venus labeled cells with condensed chromosomes within the first 30 min were tracked until the end of time-lapse imaging (2–3.5 h) or as long as we could track them (siblings: n = 50 cells, mastkt441b homozygous: n = 66 cells, from 3 embryos each). We classified tracked cells as follows. normal: normal cell division, missegregation: chromosomes were scattered around an elongated spindle, and cytokinesis was completed to pinch off some of the chromosomes, no segregation: cytokinesis was completed without obvious chromosome segregation, prolonged metaphase: metaphase was prolonged for more than 60 min without chromosome segregation or cytokinesis; decondensation: decondensation of chromosomes without segregation. cell death: change to hypercondensed nucleus. Time lapse images of representative cells for each type are shown in (D). (D) Time lapse images of representative cells for each type shown in (C). Green indicates membrane-Venus, while magenta indicates Histone H2A-mCherry. Mitotic cell types were classified as described in (C). White arrows: mother cells with condensed chromosomes; Yellow arrows: daughter cells with condensed chromosomes; Orange arrows: hypercondensed chromosomes. Since the state of chromosome condensation was sometimes unclear, we carefully judged it referring the orthogonal views. Scale bar, 20 μm.

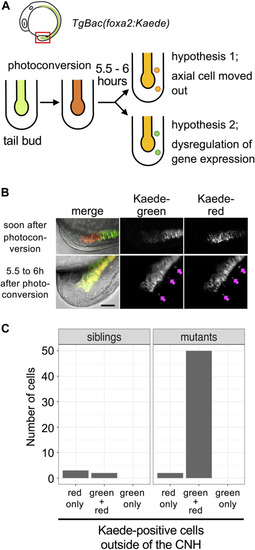
Detachment of CNH cells in mastlkt441b homozygous embryos. (A) The experimental design. mastlkt441b heterozygous male and female fish harboring transgene Bac(foxa2:Kaede) were crossed, and CNH cells of the progeny were photoconverted at the 4 to 5-somite stage. Five and half to 6 h after photoconversion, pictures of embryos were taken. Two hypotheses depicted in the figure can be distinguished by examining whether photoconverted (judged by red fluorescence) Kaede still remains in detached cells. (B) Examples of photoconverted tails. Pink arrows indicate Kaede-positive cells located outside the axial tissue observed at 5.5–6 h after photoconversion. Scale bar, 50 μm. (C) Kaede-positive cells outside of the CNH at 5.5–6 h after photoconversion were counted. The total number of cells of 3 embryos in the siblings or mastlkt441b homozygous mutant are shown.

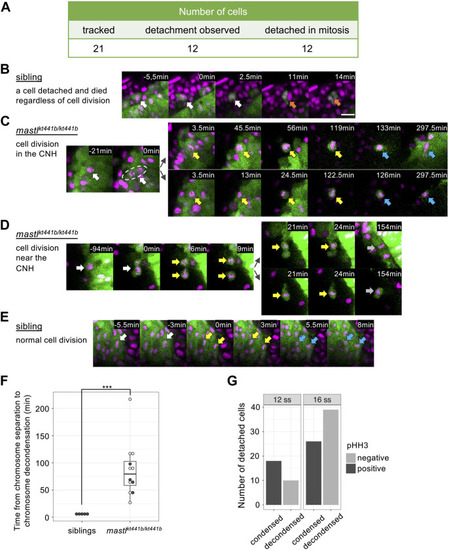
Cell detachment is related to aberrant mitosis in mastlkt441b homozygous embryos. Time-lapse imaging was carried out focusing on the tailbud region of mastlkt441b homozygous embryos carrying the Bac(foxa2:Kaede) transgene at the 8 to 16-somite stage. Kaede-positive cells that detached from the CNH were reverse tracked. (A) Summary of the tracking of detached cells in mastlkt441b homozygous embryos. Among 21 cells, 12 cells were successfully tracked back to the CNH, and all of them detached during aberrant mitosis. A schematic summary of tracked cells is shown in Supplementary Figure S3(B) Time-lapse images of one detached cell in an embryo. Only one detached cell was detached among 5 sibling embryos. It was detached from the CNH at time 0 (white arrows) and died (orange arrows) soon thereafter. Chromosomes were not condensed. Scale bar, 20 μm. (C) A representative image of cells detaching from the CNH in mastlkt441b homozygous embryos. A mother cell in the CNH (white arrows) caused aberrant chromosome segregation at time 0. Both daughter cells detached from the CNH and maintained condensed chromosomes after segregation for around 2 h (yellow arrows). Their chromosomes appeared to decondense later (blue arrows). One of the daughter cells (upper panel) returned to the CNH. In this experiment, mastlkt441b homozygous embryos harboring the Bac(foxa2:Kaede) transgene were used. Nuclei were labeled by injection of Histone H2A-mCherry mRNA into 1 blastomere of the 8-cell stage. Green: CNH cells, magenta: Histone H2A-mCherry. (D) A representative cell that was detached and then divided near the CNH in mastlkt441b homozygous embryos. White arrows: the mother cell; Yellow arrows: condensed chromosomes; Gray arrows: chromosomes that could not be judged condensed or decondensed. (E) A representative image of normal cell division of CNH cells in sibling embryos. White arrows: metaphase; Yellow arrows: anaphase; Blue arrows: decondensed chromosomes in telophase. (F) Duration of the onset of chromosome segregation (anaphase) to chromosome decondensation. Detached cells were analyzed in mastlkt4441b homozygous embryos, comparing with CNH cells in siblings. In many cases, daughter cells in mastlkt4441b homozygotes could not be tracked until chromosome decondensation, because some daughter cells framed out, displayed reduced Kaede signals, or maintained condensed chromosomes until the time end of imaging (shown by open circles). On the other hand, examples in which time from chromosome segregation to chromosome decondensation was measured in the period of time-lapse imaging is shown by closed circles. Box plots of duration in each genotype show the first and third quartile, a line represents the median, and whiskers indicate the minimum and maximum inside 1.5 IQR (inter-quartile range). The time difference was statistically evaluated using the exact Wilcoxon-Mann-Whitney test. ***p = 0.00016 (G) The number of detached cells in 4 mastlkt441b homozygous embryos at the 12-somite stage and the 16-somite stage were classified by pHH3 staining and chromosome condensation. Note that all cells with condensed chromosomes were pHH3-positive.

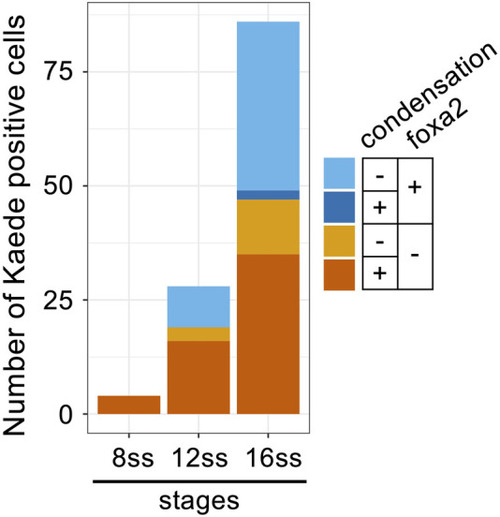
Decondensation of chromosomes and re-expression of foxa2 in detached cells in mastlkt441b homozygous embryos. Classification of cells detached from the CNH by foxa2 expression and chromosome condensation in mastlkt441b homozygous embryos carrying Bac(foxa2/Kaede) transgene at 8 ss, 12 ss and 16 ss. In situ hybridization of foxa2 mRNA and immunostaining with anti-Kaede antibody was carried out. Kaede-positive cells, i.e., cells detached from the CNH, in 4 mastlkt441b homozygous embryos are classified according to foxa2 mRNA expression and chromosome condensation. Note that most foxa2-expressing cells had decondensed chromosomes, suggesting that foxa2 expression was restarted after completion of mitosis.

Acknowledgments
This image is the copyrighted work of the attributed author or publisher, and ZFIN has permission only to display this image to its users. Additional permissions should be obtained from the applicable author or publisher of the image. Full text @ Front Cell Dev Biol