|
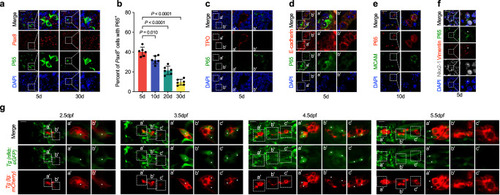
NF-κB signaling is activated in TFC with higher migratory capacity in zebrafish and mice. a, b Representative images (a) and statistical assessment (b) of the percentage of P65 positive thyrocytes, which are stained by Pax8 RNA probe from postnatal day 5 to 30 mice thyroid tissues. c P65 co-expression with TPO in postnatal day 5 mice thyroid tissues were analyzed by IF staining. Right two panels are enlarged ones collected from the peripheral (a’) and central (b’) region of the first column on the left respectively. Note that P65 positive cells were accumulated in the central region (b’), with apical TPO and lumen not established. d Cellular adhesion molecule E-cadherin expression in P65 positive cells in postnatal day 5 mice thyroid tissues were detected by IF staining. Right two panels are the enlarged ones of the first lane showing P65 positive cells in the central gland with membrane E-cadherin negative (a’) and P65 negative cells in the peripheral part with membrane E-cadherin positive (b’) respectively. e Representative images showing MCAM expression in P65 positive cells by IF in postnatal day 10 mice thyroid tissues. f Representative images showing Vimentin expression in P65 positive thyrocytes in postnatal day 5 mice thyroid tissue, labeled by white asterisks. g NF-κB activation in thyrocytes in zebrafish embryos at different time points were examined by the double transgenic Tg(nfκb:eGFP; tg:mCherry) line. The first columns in each panel show the whole mount embryos view of thyroid glands for each time point of embryos. The second and third columns are magnified and slice images of the first columns, respectively, to clearly show NF-κB activation in thyroid epithelial cells. Scale bar, 50 μm. Three independent experiments were carried for (c–g). In (b), data are shown as mean ± SD, n = 6 biologically independent samples, and statistical significance was determined by One-way ANOVA, followed by Tukey’s multiple comparison test. Source data are provided as a Source data file.
|

