|
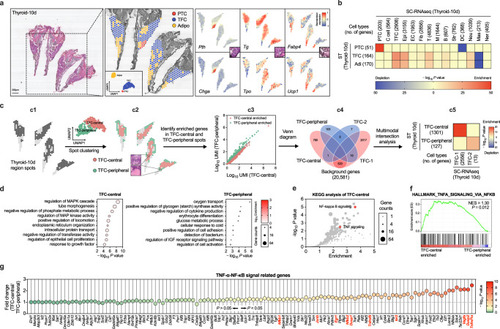
NF-κB is activated in the central immature thyrocytes of mice by spatial transcriptome sequencing. a From left to right in turn show the H&E staining, cell type annotation and representative marker genes expression in thyroid tissues. PTC: Parathyroid cells (PTC), TFC: thyroid epithelial cells (TFC), Adipo: adipocyte. Dot color intensity represents the z-score of gene expression values. b Multimodal intersection analysis (MIA) map of all scRNA-seq-identified cell types and ST-defined regions. P value calculated by hypergeometric test. The numbers of cell type- and tissue region-specific genes used in the calculation are shown in the brackets. c MIA analysis was utilized to examine the relation between scRNA-seq-identified TFC subtypes and ST-defined TFC subclusters. Based on our ST-seq data, UMAP analysis identified two TFC subclusters (c1), one of which was in the central of thyroid tissues and the other in the peripheral region (c2). Genes with significantly higher expression in each spatial region relative to the others were then identified (c3). The overlap between each pair of cell type-specific and tissue region-specific gene sets was analyzed using MIA (c4). The significance of the intersection was displayed using the hypergeometric distribution. (c5). The numbers of cell subtype-specific and tissue region-specific genes used in the calculation are shown in the brackets. d GO enrichment analysis of the DEGs between TFC-central and TFC-peripheral. e KEGG analysis of the TFC-central highly expressed genes. Red dots signify the genes in the TNF and NF-κB signaling pathway. f Analysis of “HALLMARK_TNFA_SIGNALING_VIA_NFKB” gene set between TFC-central and TFC-peripheral spots by GSEA software, the NES and FDR P value were shown. g Fold changes of TNF-α-NF-κB pathway genes comparing TFC-central with TFC-peripheral cell spots. Dot color intensity represents the -log10P values (Two-tailed t test). The dotted horizontal line indicates fold change = 1, and the dotted vertical line show P = 0.05. Gene names marked in red were also highly expressed in TFC-1 subtype when compared with TFC-2 by scRNA-seq. In (d and e), P value was determined by Benjamini-Hochberg-adjusted one-sided hypergeometric test. Source data are provided as a Source data file.
|

