Fig. 1
- ID
- ZDB-FIG-231106-58
- Publication
- Virtanen et al., 2023 - Effect of caldesmon mutations in the development of zebrafish embryos
- Other Figures
- All Figure Page
- Back to All Figure Page
|
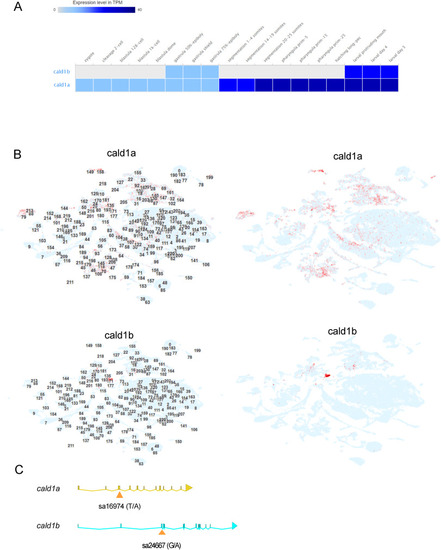
The in silico analysis of cald1a and cald1b mRNA expression, and the mutations (A) Whole-embryo RNA-seq data for cald1a and cald1b from zebrafish embryo developmental time series. Data obtained from Expression Atlas (www.ebi.ac.uk/gxa/home, dataset E-ERAD-475, data downloaded January 3rd, 2023). (B) Single-cell RNA-seq data for developing zebrafish embryos. Data obtained from USCS Cell Browser (http://cells.ucsc.edu/?ds=zebrafish-dev, data obtained January 3rd, 2023). The numbers in left panels refer to cell cluster ID numbers and in the right panels these are omitted for clarity. (C) Schematic illustration of the location of mutations in cald1a and cald1b genes. Exons are marked as bars and connected by lines representing introns. Mutation sa24667 locates in exon 3 of cald1a, disrupting the essential splice site. The first 67 amino acids of 778 amino acids in cald1a are predicted to be intact in cald1a(sa24667) mutant. Mutation sa16974 locates in exon 3 and creates a premature stop codon. The first 190 amino acids of 778 amino acids in cald1b are predicted to be intact in cald1b(sa16974) mutant. |

